Cross-domaindraftMar 2026
Cross-Domain Temporal Clustering Atlas: Inter-Event Time Analysis Across Environmental Metrics
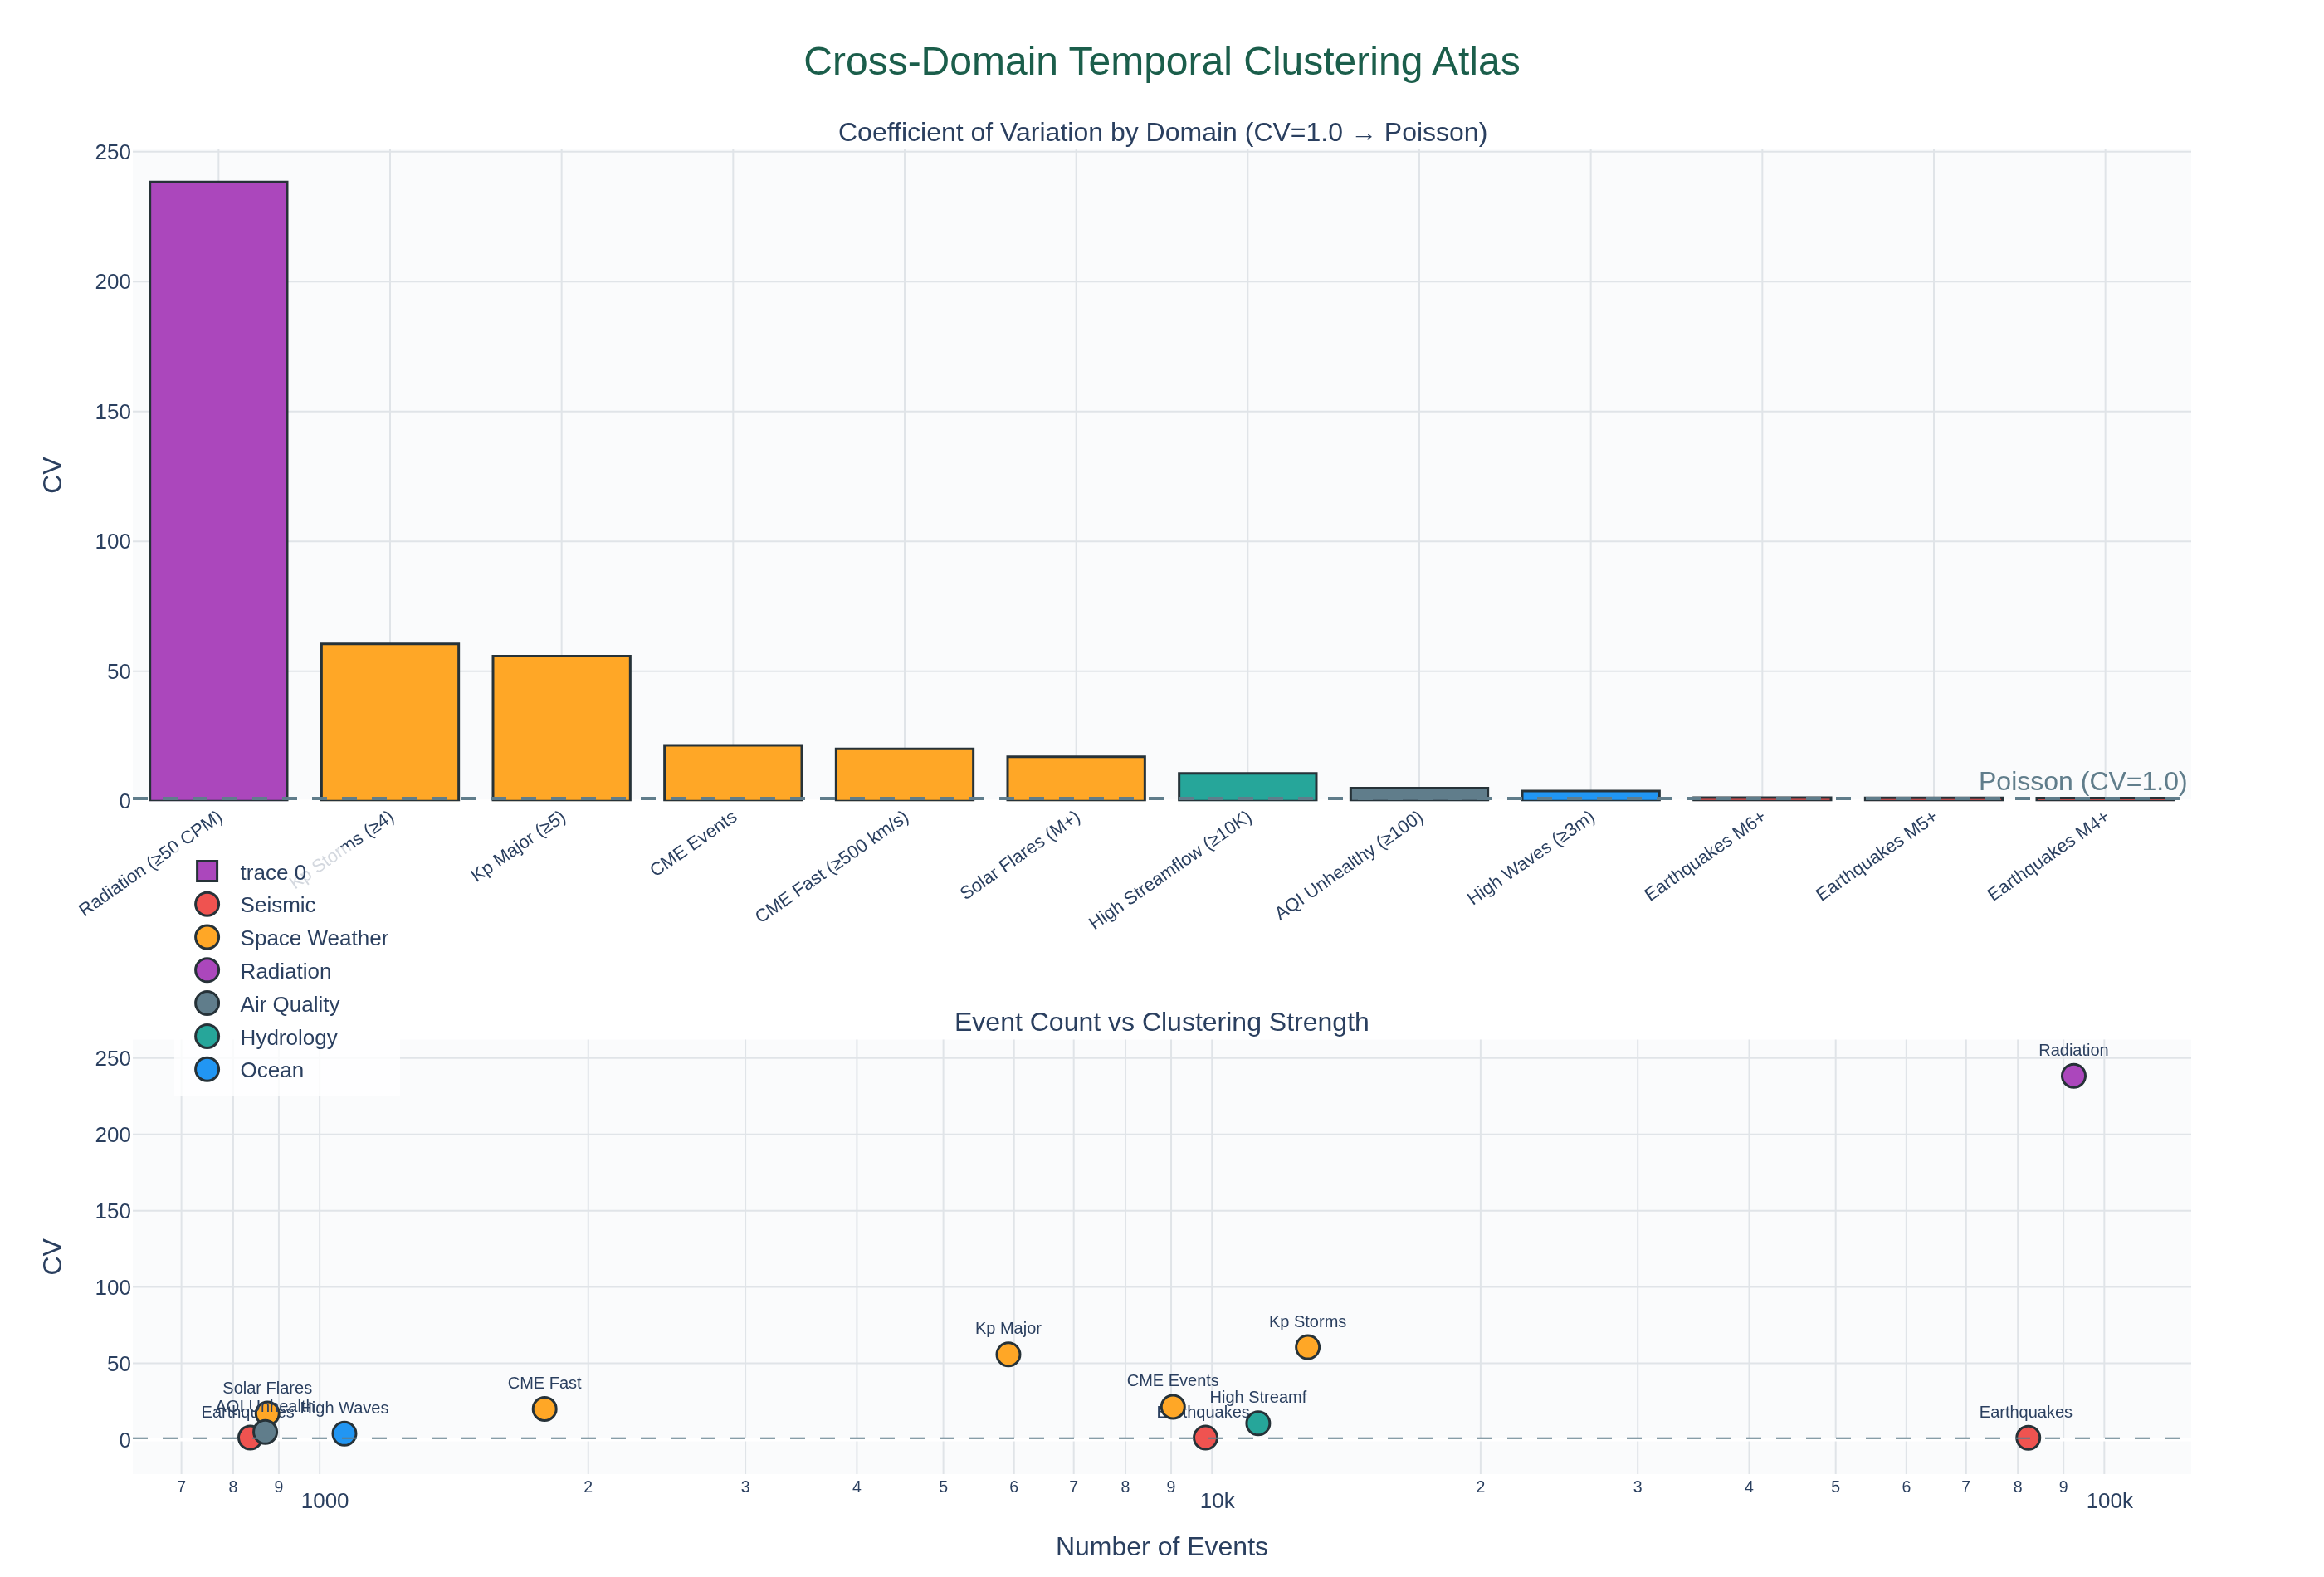
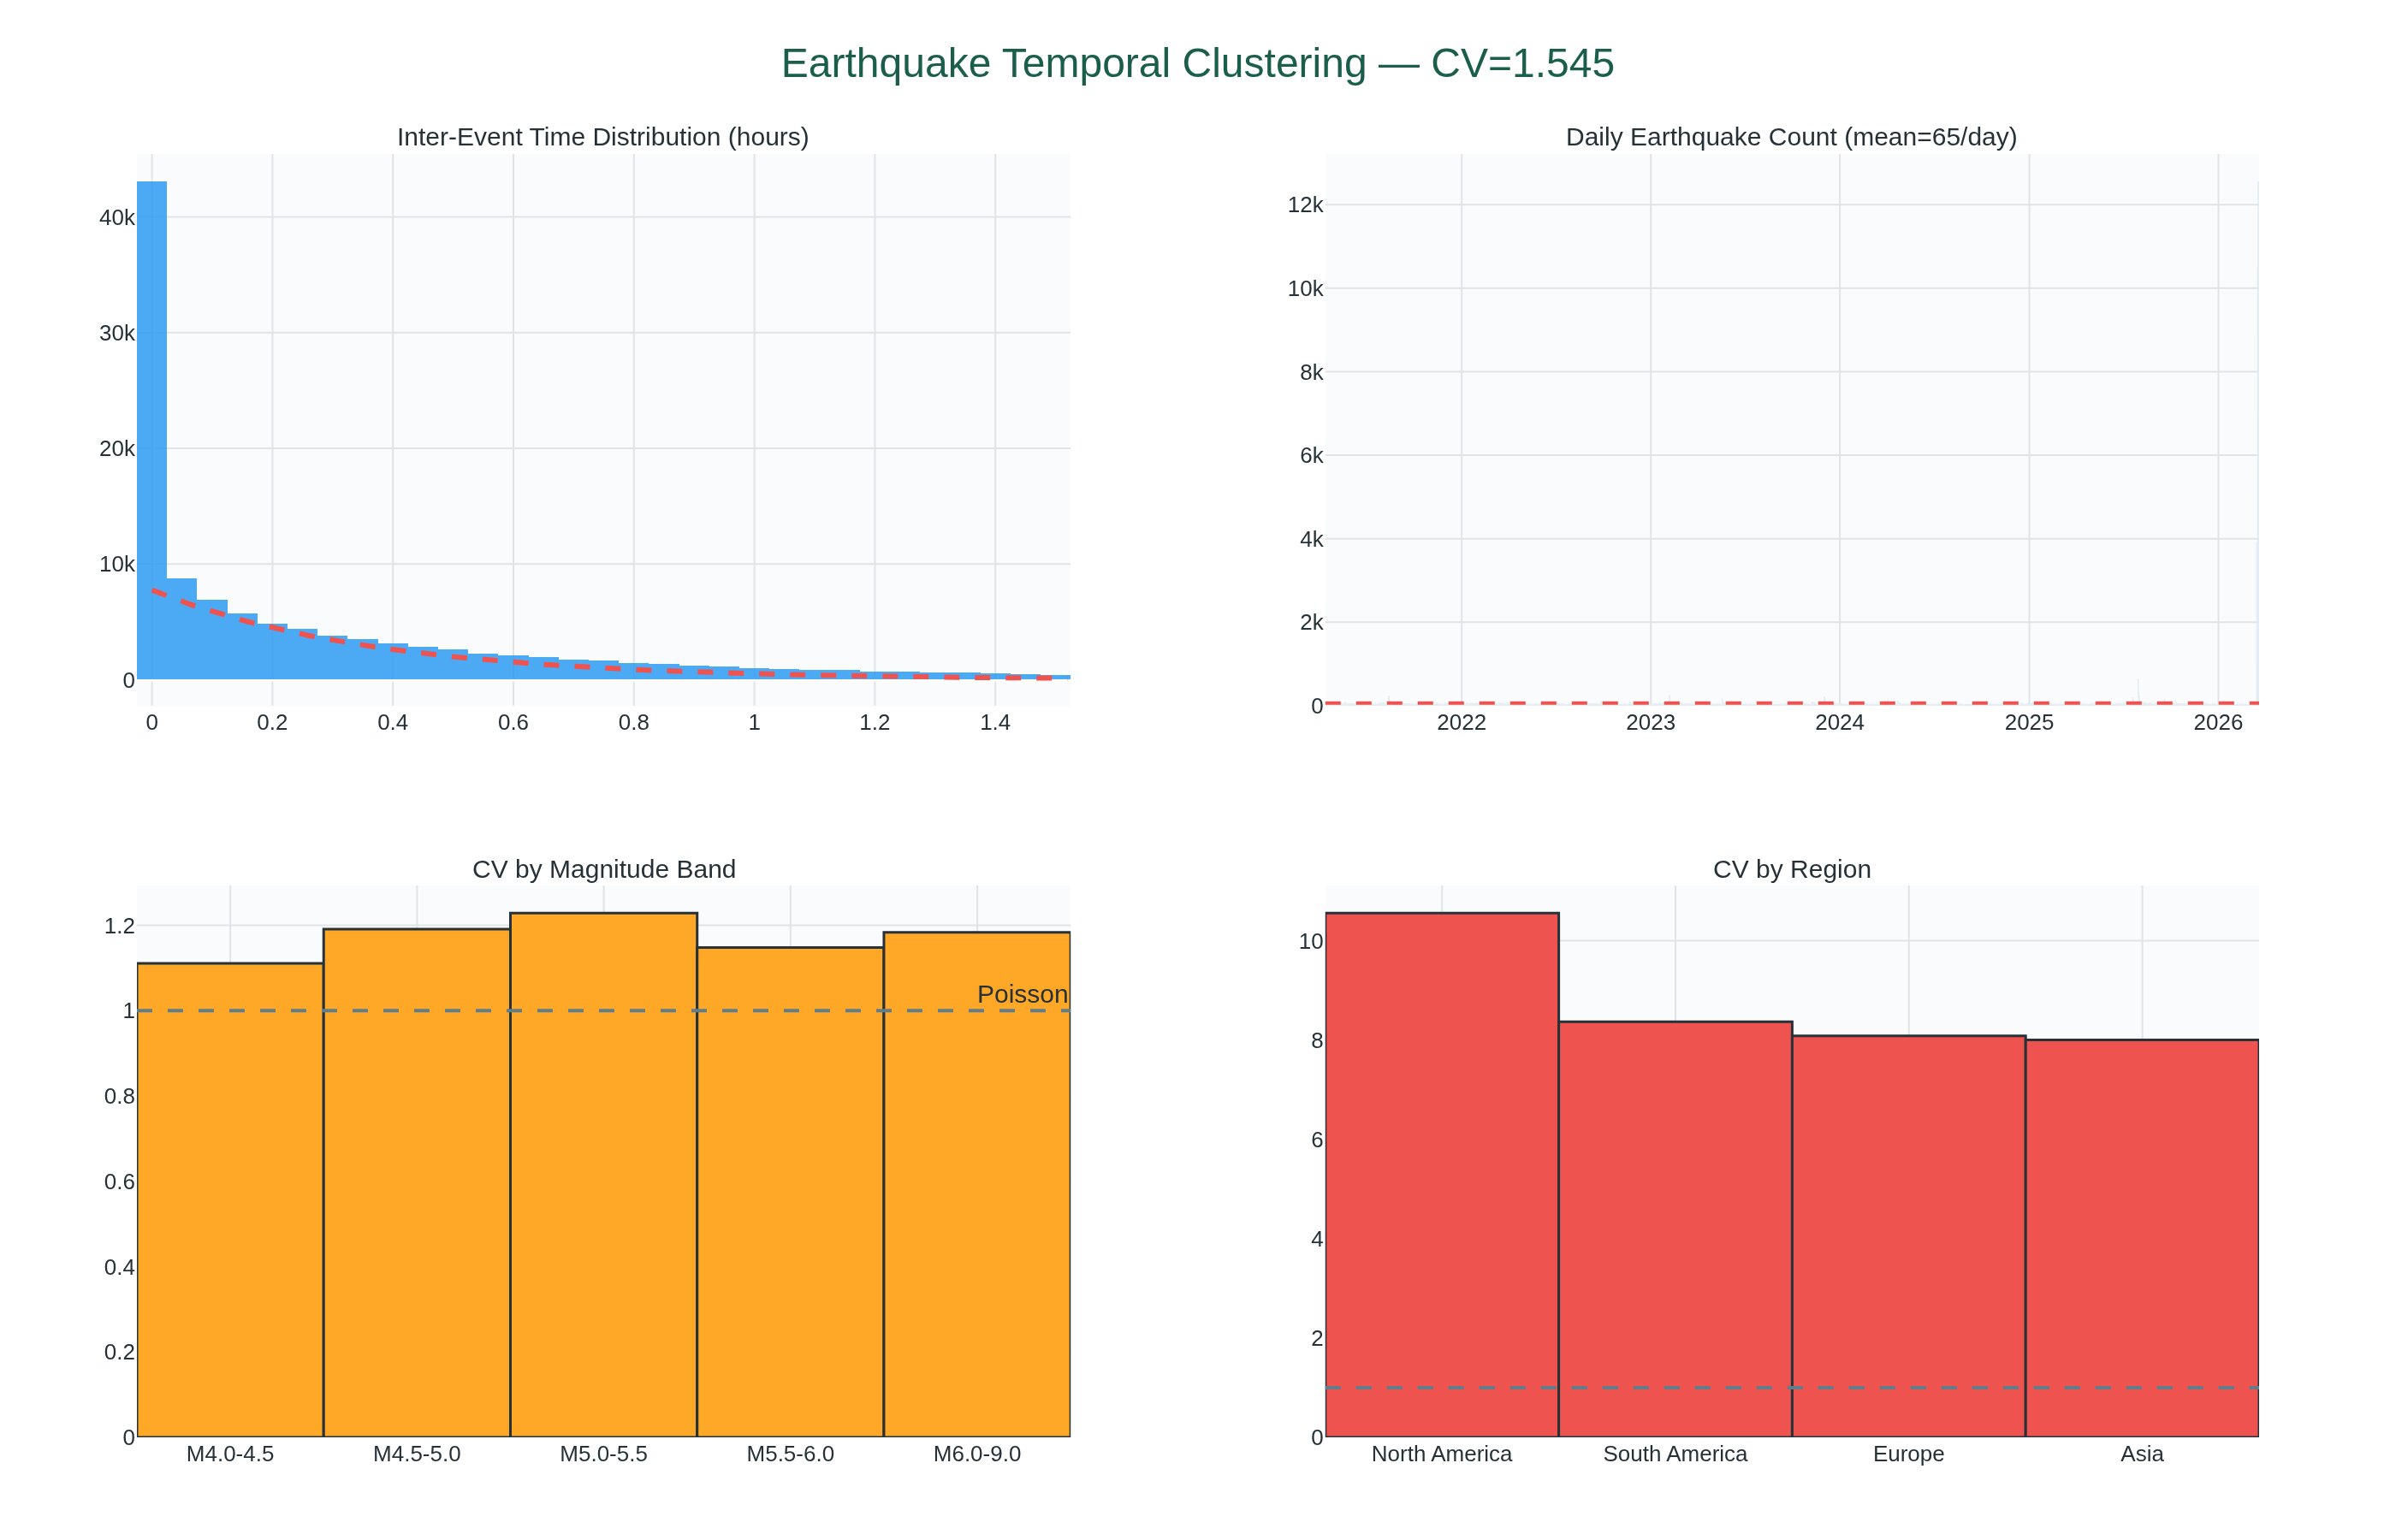
Applying the coefficient of variation (CV) inter-event time method proven on earthquakes (CV=1.545) to CMEs, radiation spikes, geomagnetic storms, AQI exceedances, and flood events. Building a clustering atlas across domains.
The 1.545 above is the parent study’s result, Temporal Clustering of Global M4+ Earthquakes, measured on 118,009 M4.0+ earthquakes from 2021 to 2026. This atlas counted its own earthquake streams, so the M4+ figure in its key finding comes from a different set of events.
Key findingCV above 1
12 of 12 event streams bunch in time: the gaps between events vary more than random timing would give.
Time between events, the first 6 of 12 streams| Event stream | CV (random = 1) |
|---|
| Earthquakes M4+82,189 events, mildly clustered | 1.17 |
|---|
| Earthquakes M5+9,836 events, mildly clustered | 1.30 |
|---|
| Earthquakes M6+836 events, clustered | 1.32 |
|---|
| Kp Storms (≥4)12,804 events, clustered | 60.58 |
|---|
| Kp Major (≥5)5,914 events, clustered | 55.81 |
|---|
| CME Events9,043 events, clustered | 21.49 |
|---|
CV is the coefficient of variation of the time between events: its spread over its mean. Random timing gives 1; above 1, events come in bunches with long quiet gaps between.
in revisionSep 2026
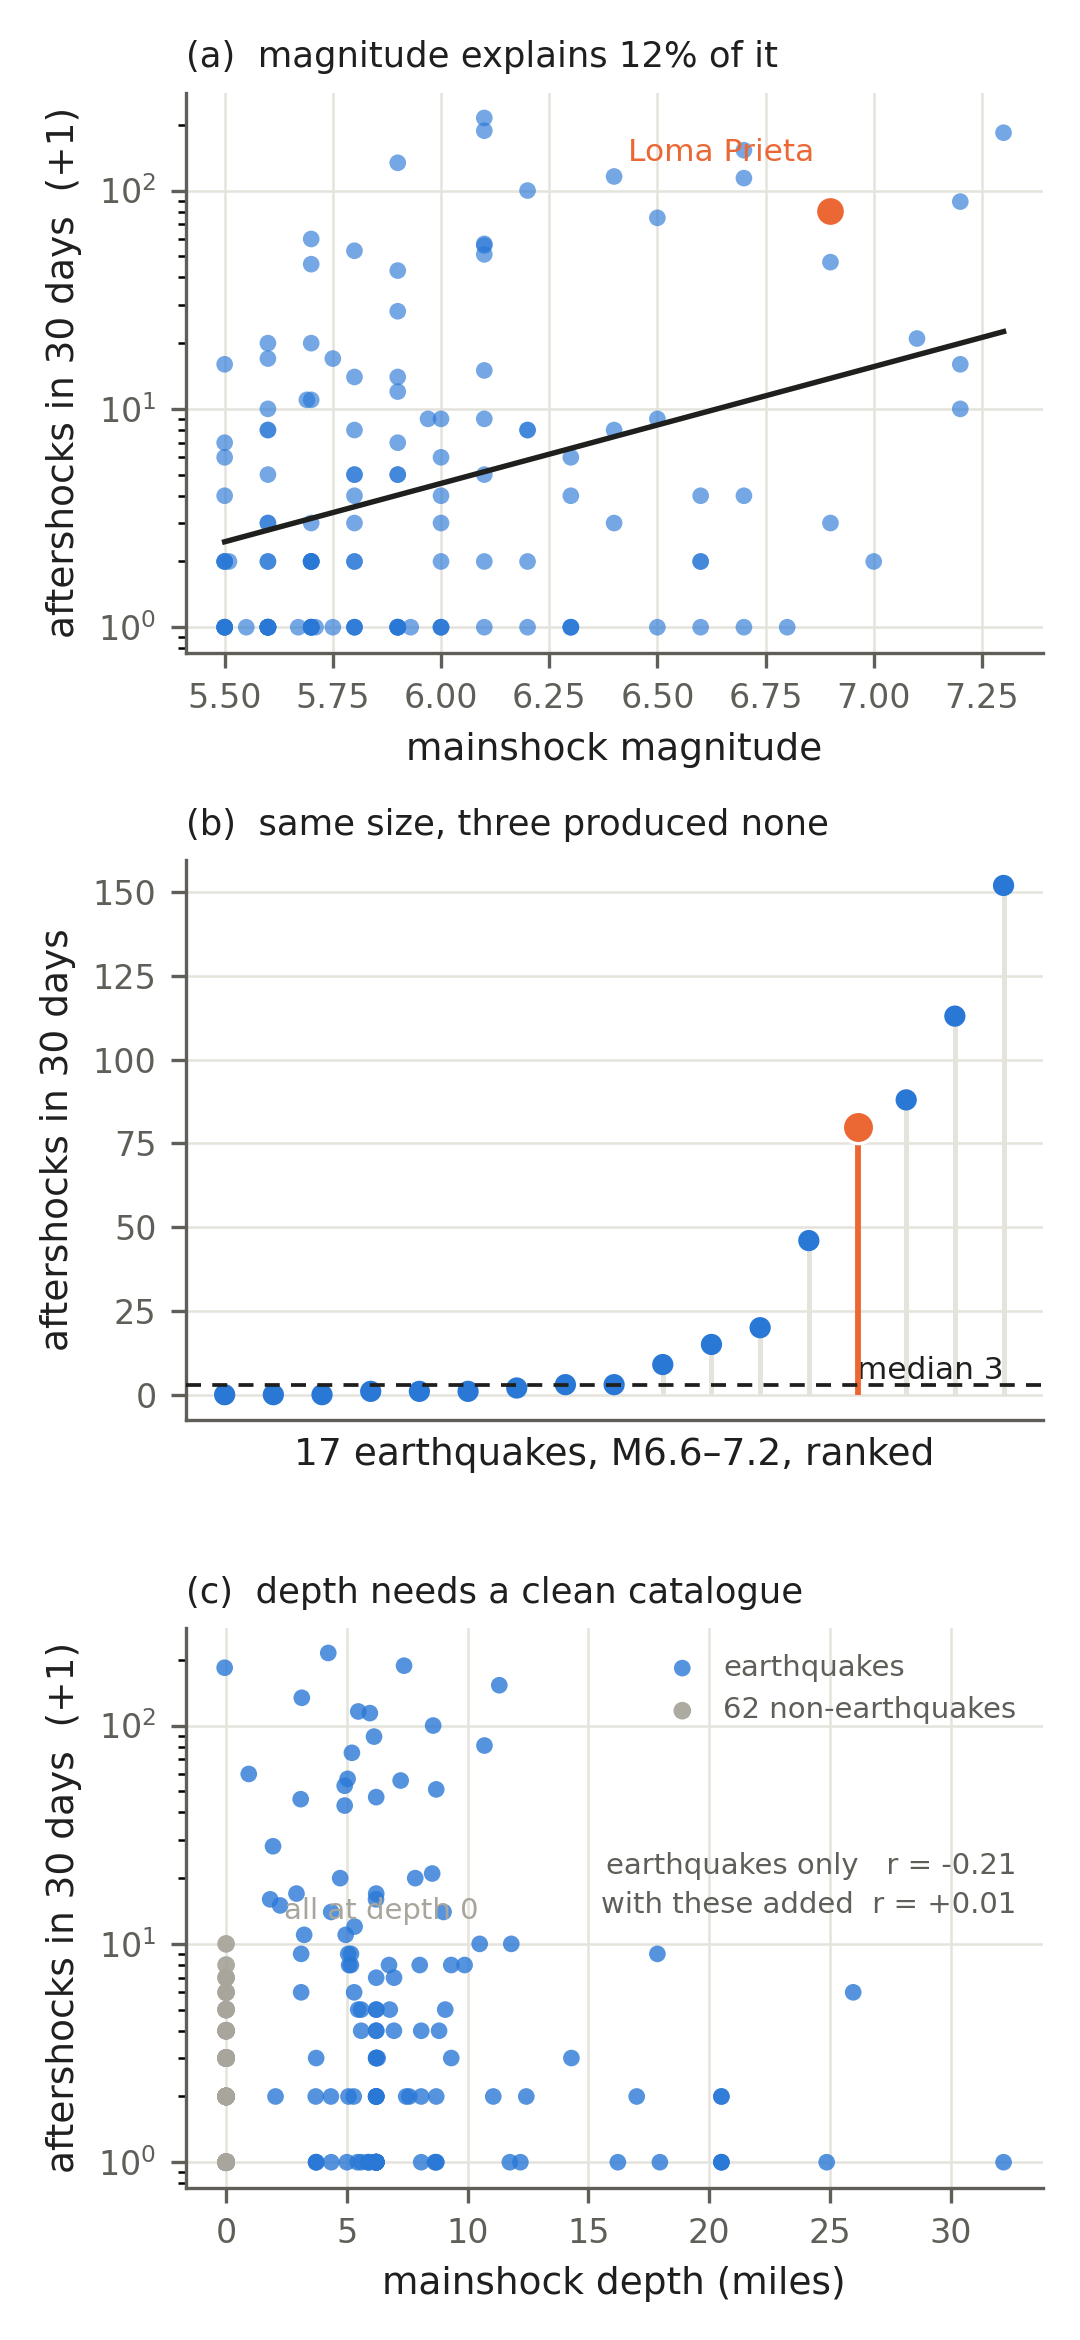
Three Aftershocks, or 183? Same Size Quake, Either Answer.
Loma Prieta produced 80 aftershocks of magnitude 3 and above in its first month, squarely in the middle of its era.
Rest of the abstract
The record around it swings sixtyfold across nearly identical magnitudes, and the obvious explanation does not survive the data.
draftSep 2026
When One Report Says Golf-Ball Hail, How Often Does the Next One Disagree?
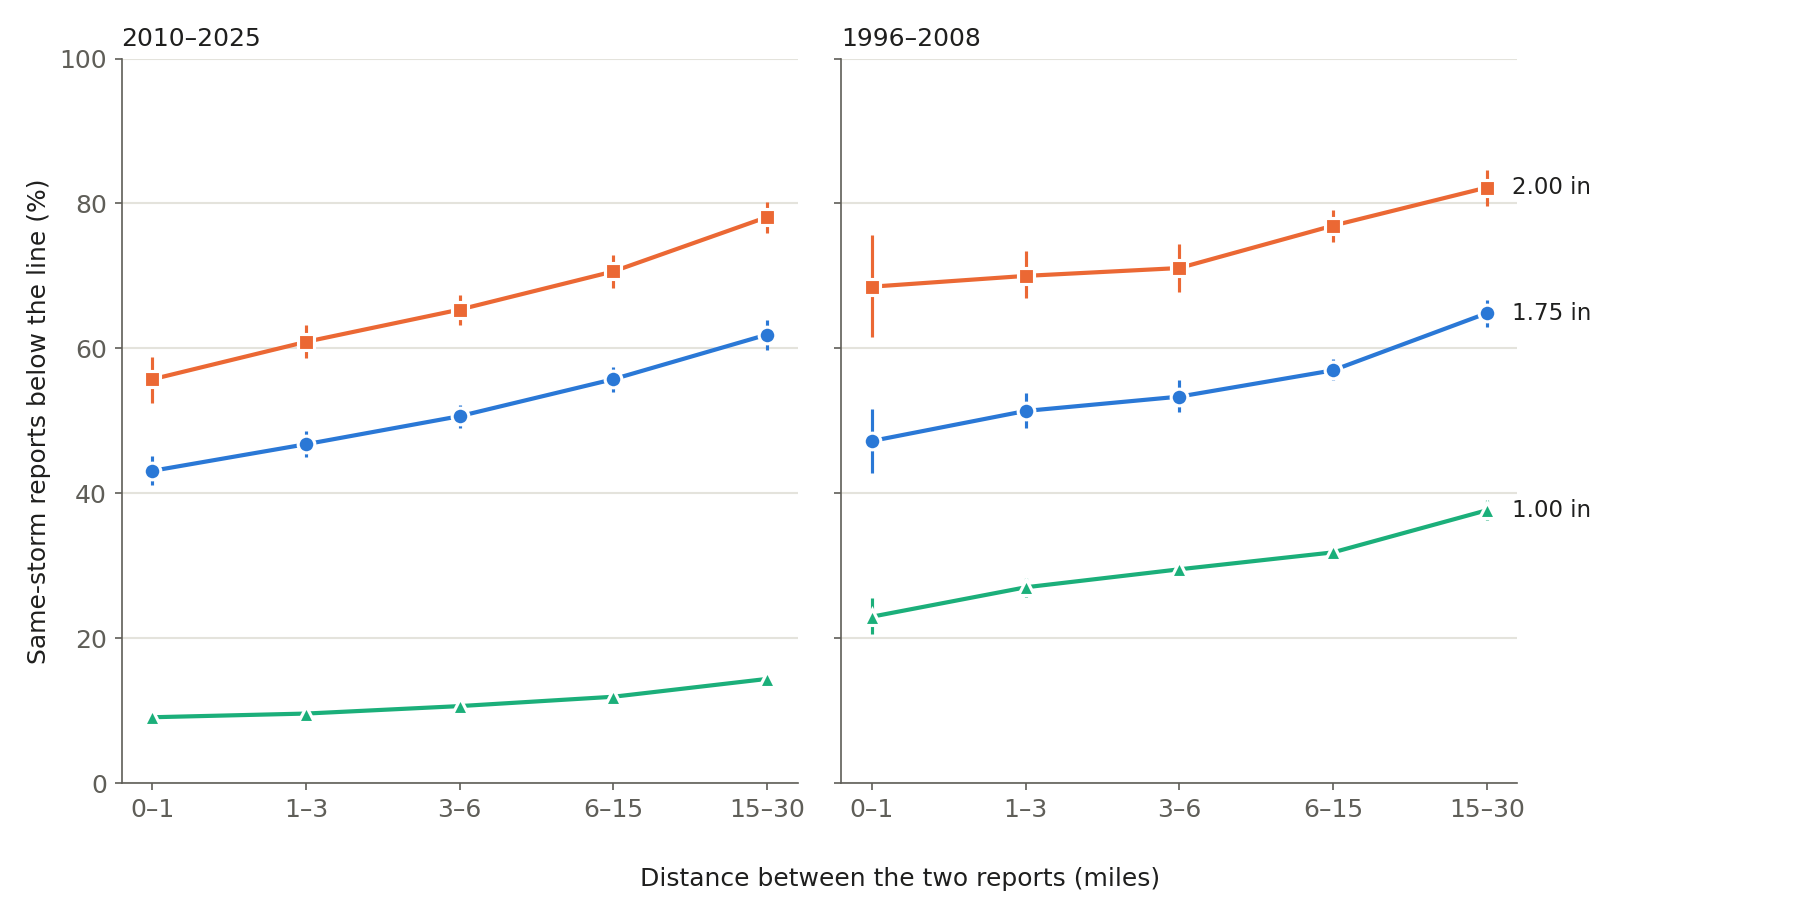
Same-storm pairs of US hail reports, 1996-2025: of the neighbouring reports within a mile of a golf-ball report, 43.1% came in below golf-ball size (2010-2025), rising to 61.9% at 15 to 30 miles, against 78.5% for a report with no link. The basis risk a report-based trigger inherits, measured on NCEI Storm Events.
in reviewSep 2026
How Many Rain Days Does a Jobsite Actually Lose?
How many working days does a US jobsite actually lose to rain, measured hour by hour in local time rather than inferred from daily totals?
draftSep 2026
How Much Warning Does a Tornado Actually Give?
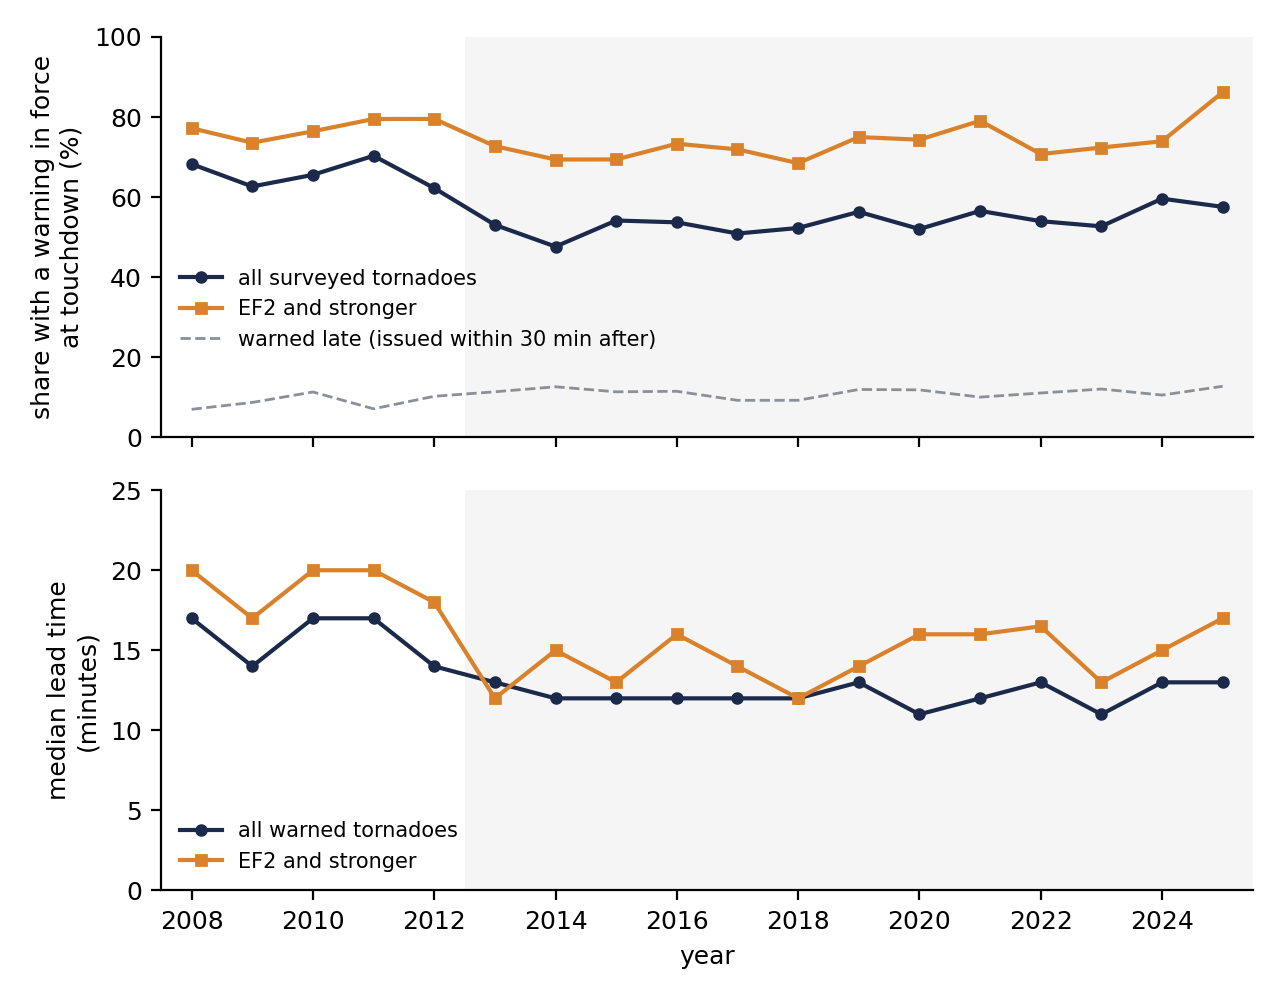
Eighteen seasons of storm-based tornado warnings joined to every surveyed tornado touchdown, 2008-2025: how often a warning was in force, how many minutes ahead, and whether night changes the answer.
draftSep 2026
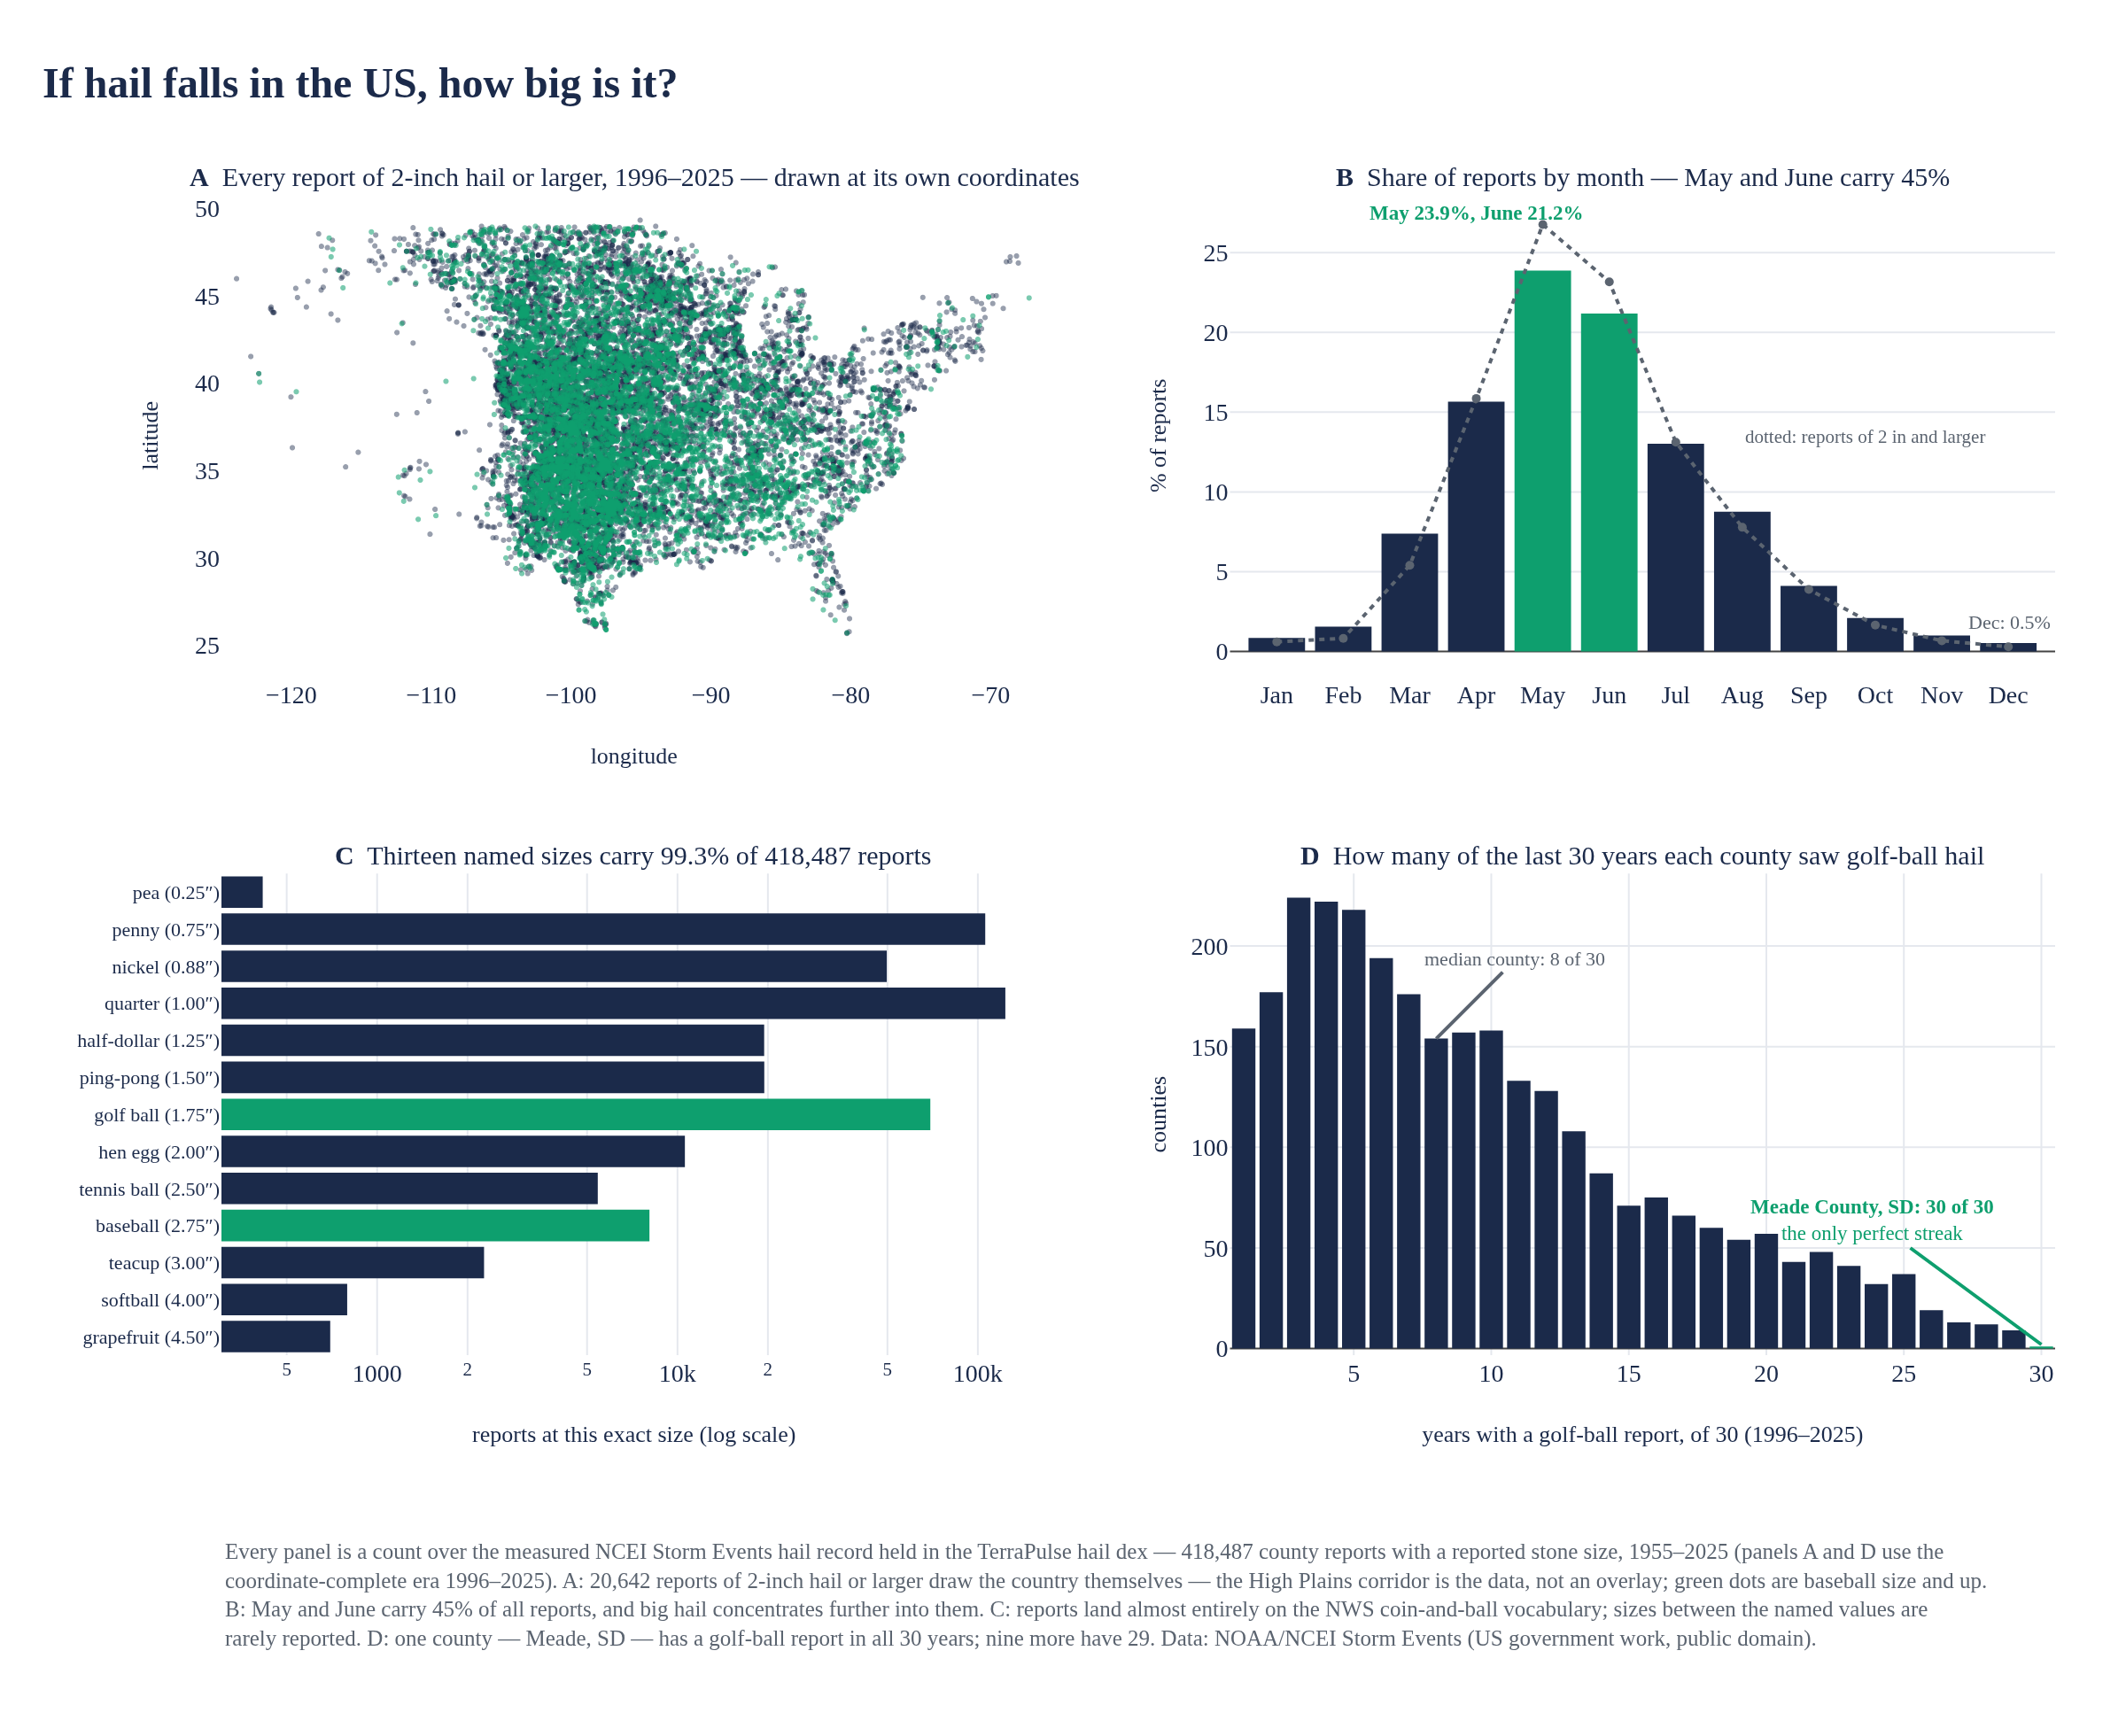
If Hail Falls in the US, How Big Is It?
Seventy-one years of measured NCEI hail reports: size, place, season, and the counties where big hail returns every year, 1955-2025.
Space weatherdraftSep 2026
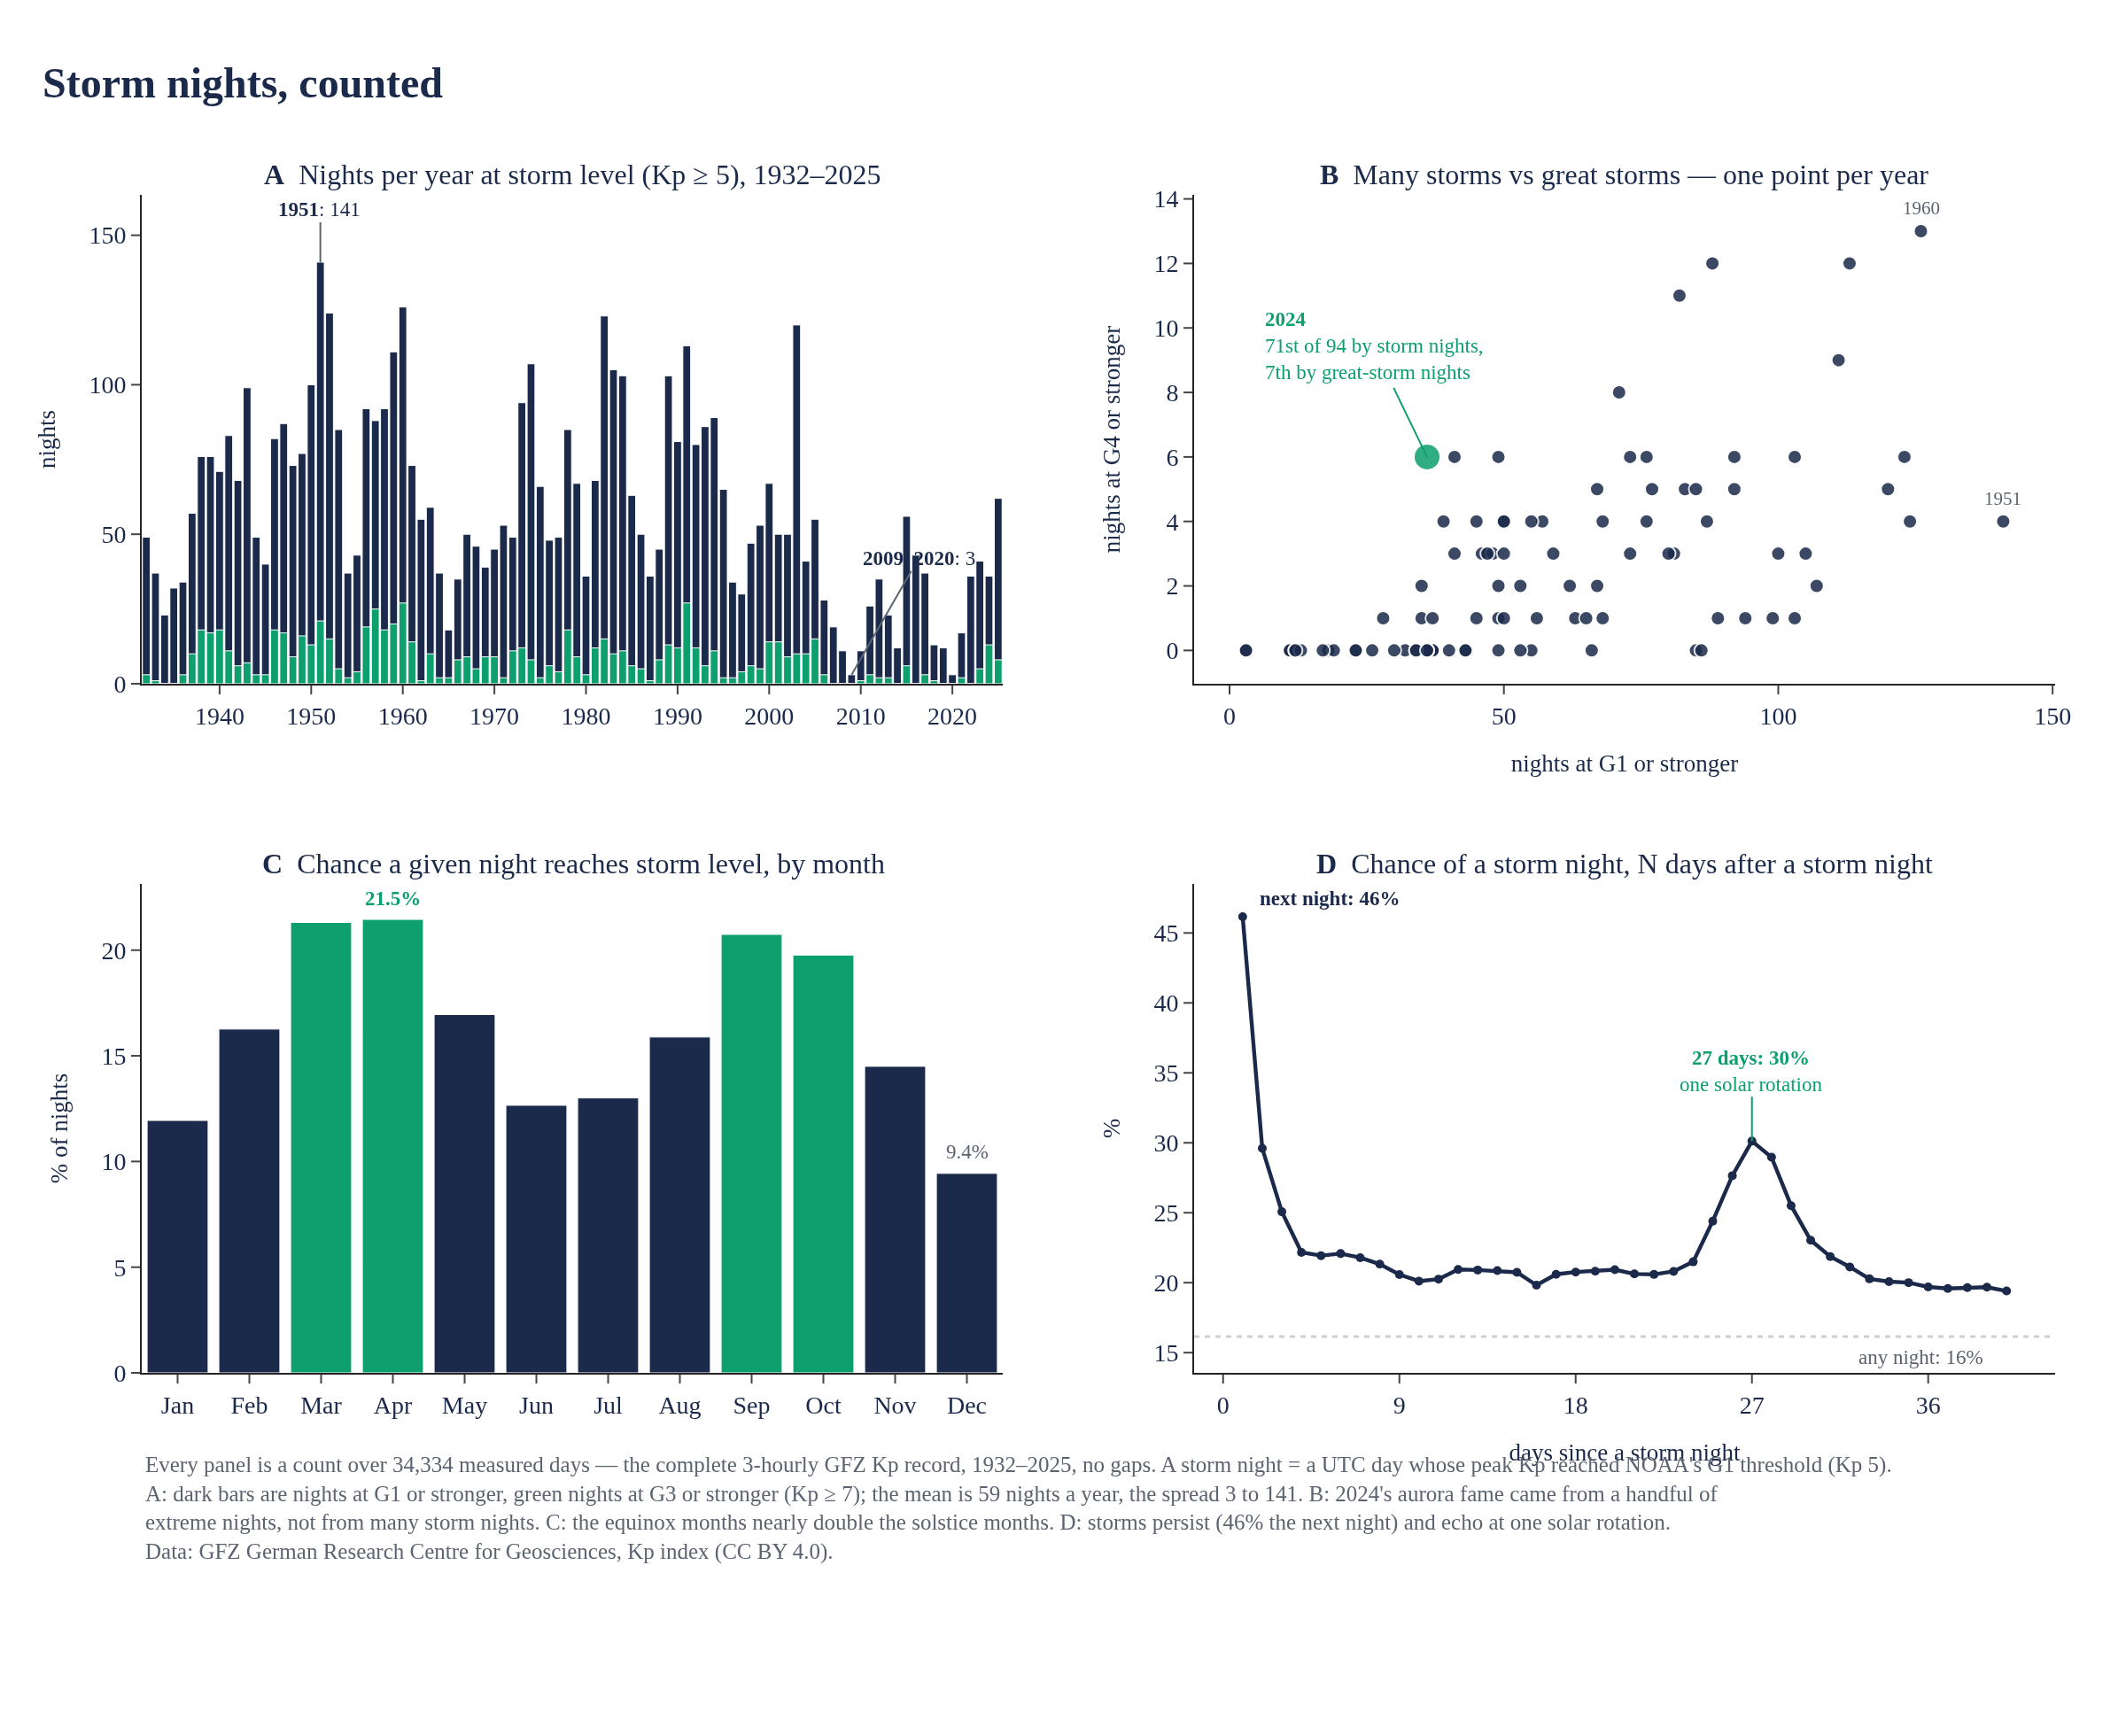
Storm Nights, Counted
How many nights a year the planetary Kp index reaches geomagnetic storm level, 1932-2025.
ClimatedraftAug 2026
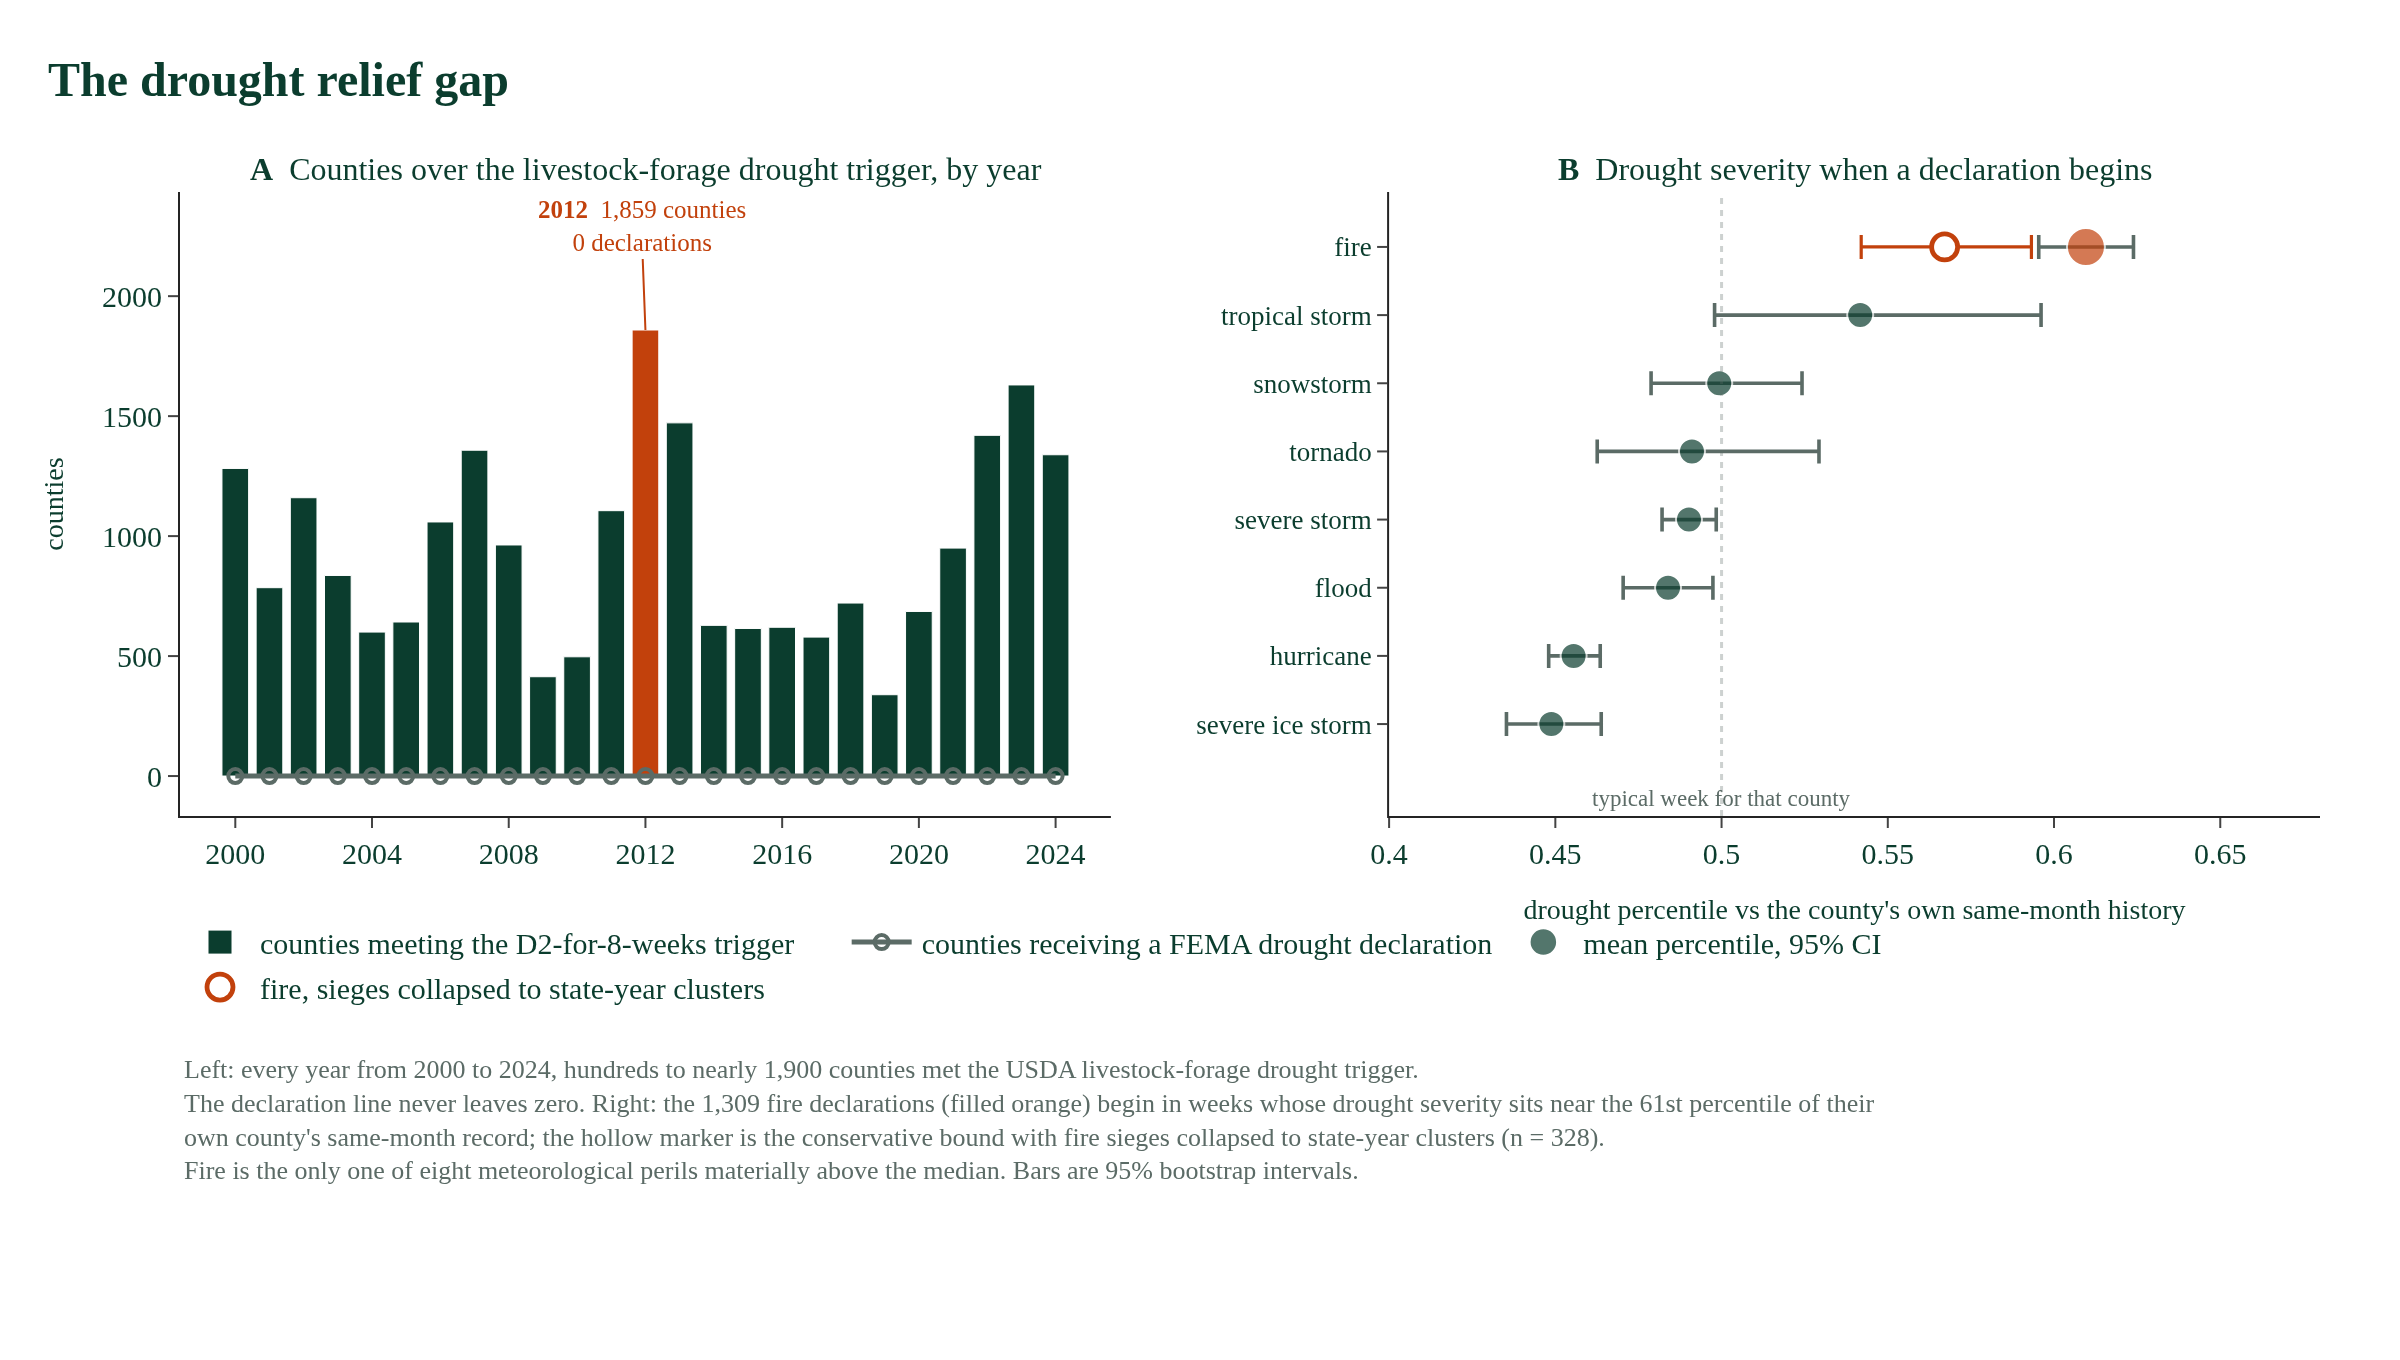
Drought Relief Gap
Measured drought severity against FEMA disaster declarations, 2000-2024.
in reviewAug 2026
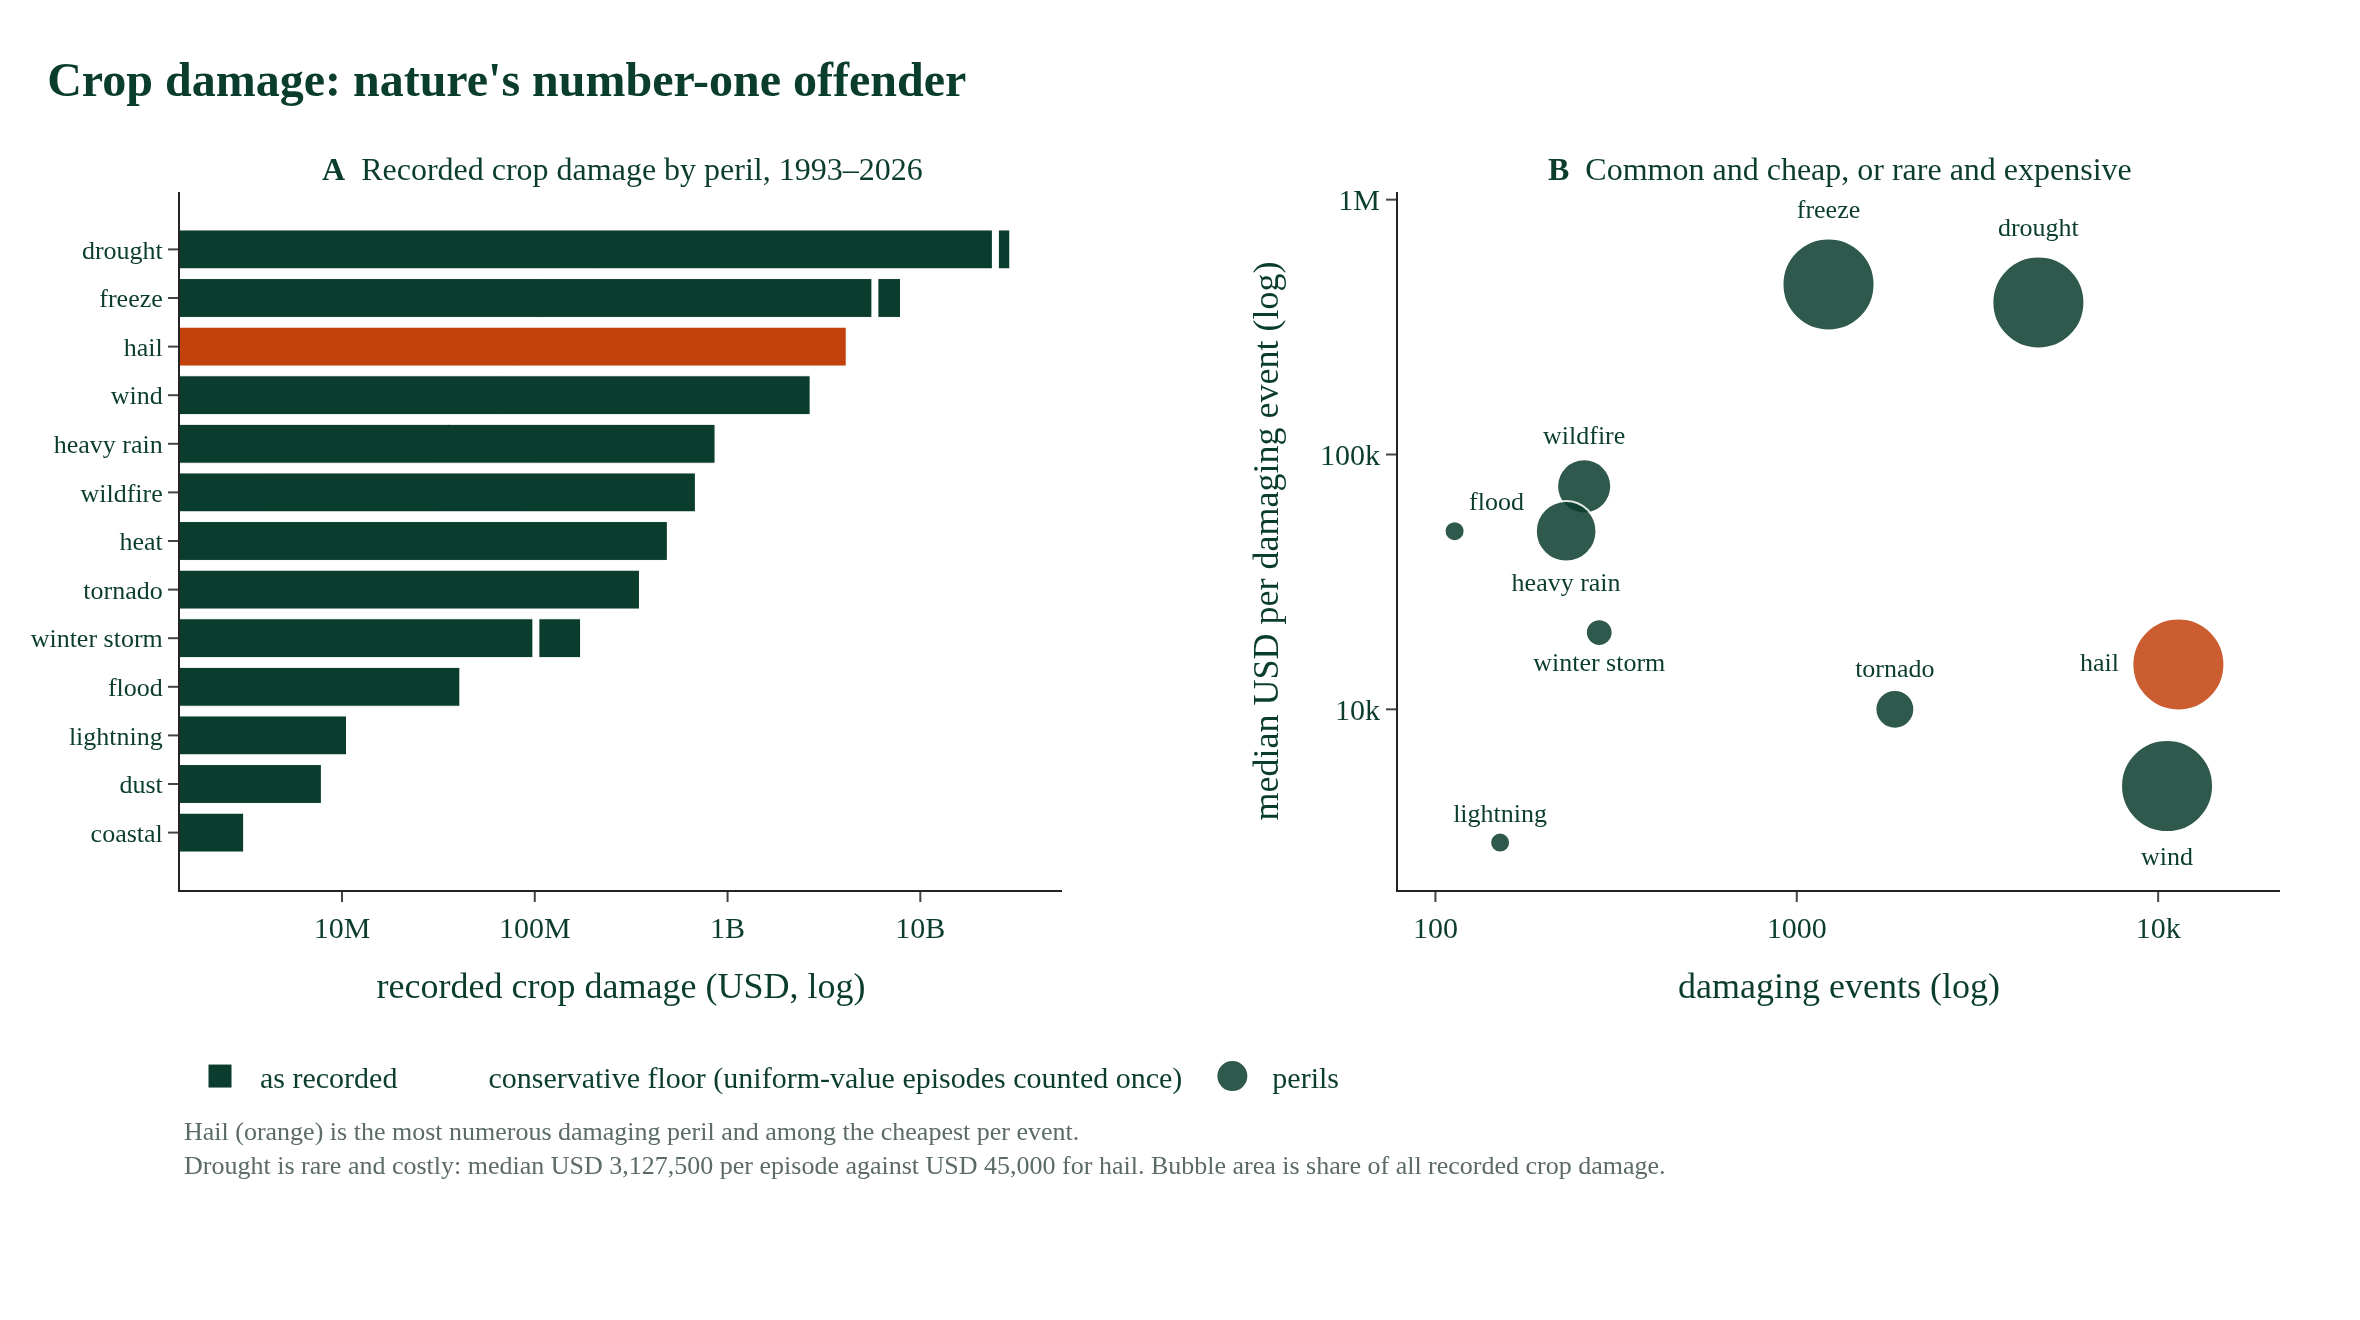
Crop Damage: Nature's Number-One Offender
Which perils account for measured US crop damage, in what proportion, and how does loss per event differ?
Space weatheracceptedMay 2026
CNEOS fireball day-of-year vs. meteor-shower calendar (1998-2026)
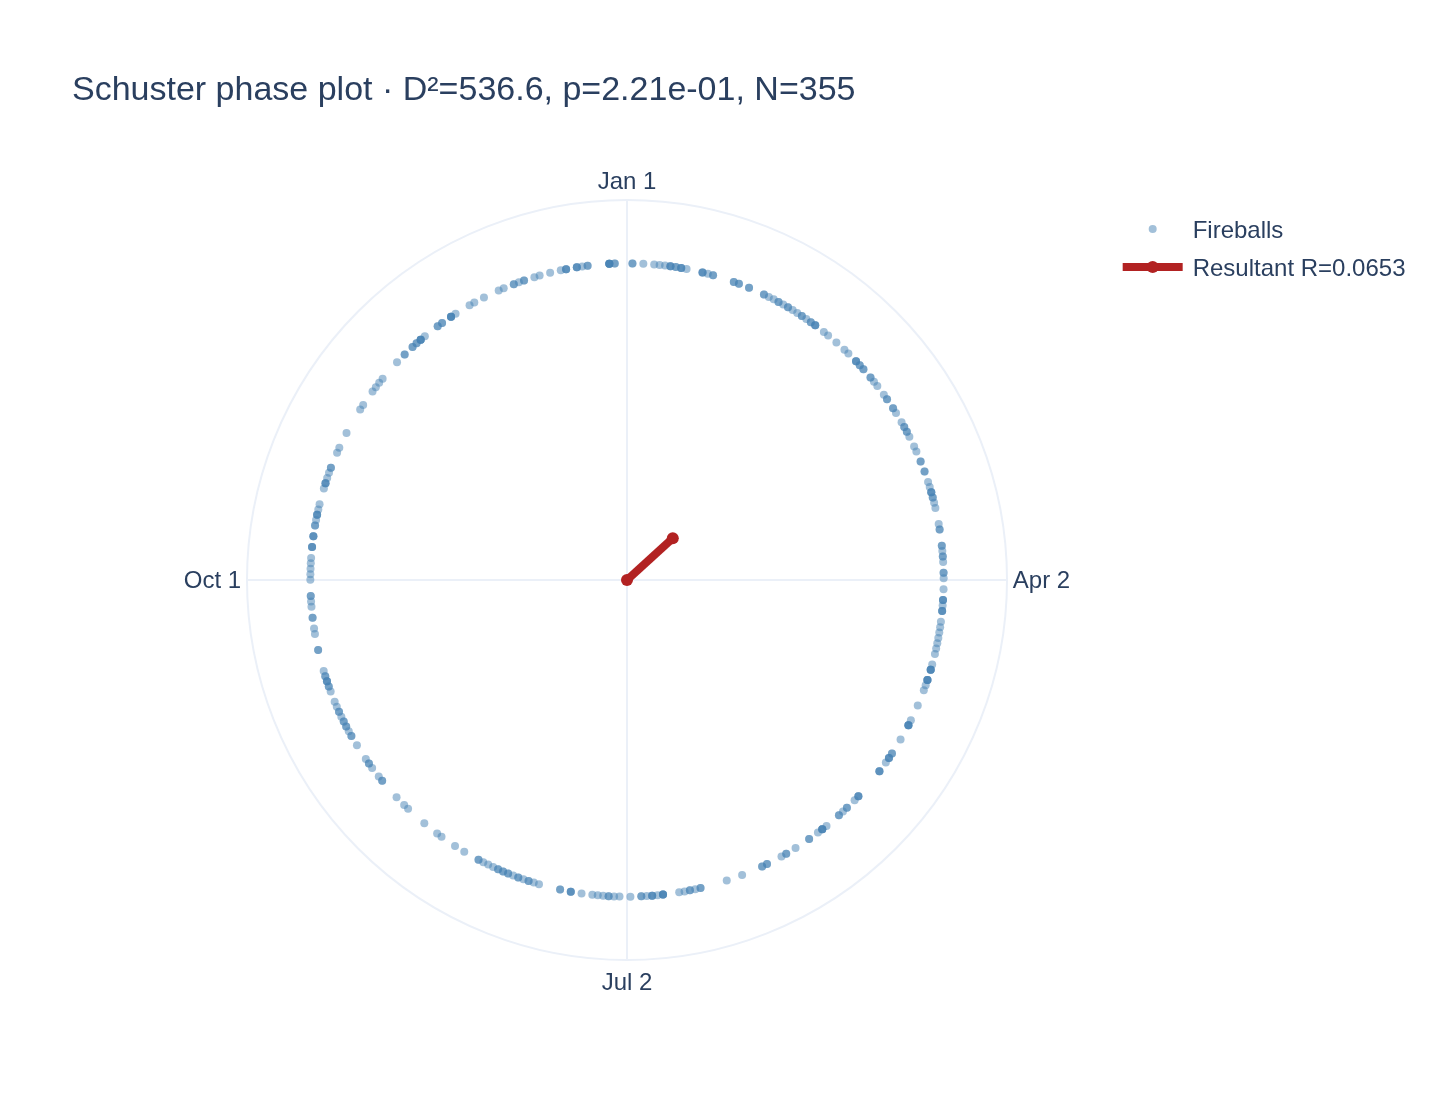
CNEOS fireball day-of-year tested against 12 named meteor shower peaks. Clean null after deduplication: Schuster p=0.22, zero showers survive Bonferroni at any window width.
Rest of the abstract
Detection floor at N=355 is rate ratio >=1.96 (Bonferroni-12); optical-bolide Geminid ratios of 1.3-1.5 are below the floor.
completeMay 2026
AQI Anomaly Characterization Across 10 Global Cities
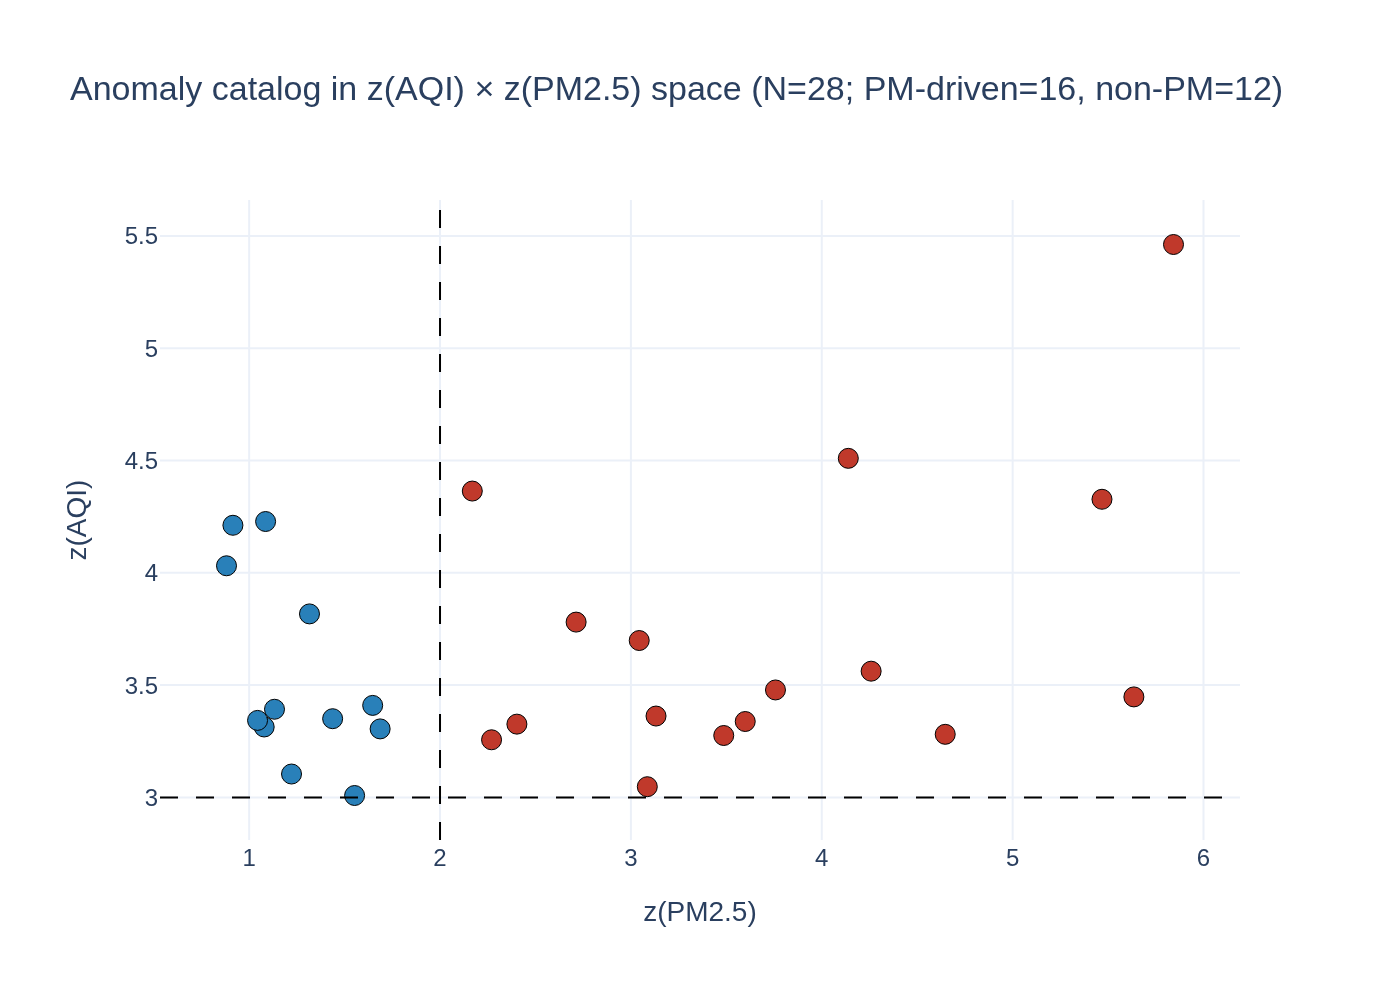
Cluster >3sigma AQI anomaly days across 10 cities by their constituent-pollutant signatures (PM2.5, PM10, O3, NO2, SO2, CO).
SeismologycompleteMay 2026
M6.6 Sanriku 2026-05-15: foreshock signature and Bath's-law test
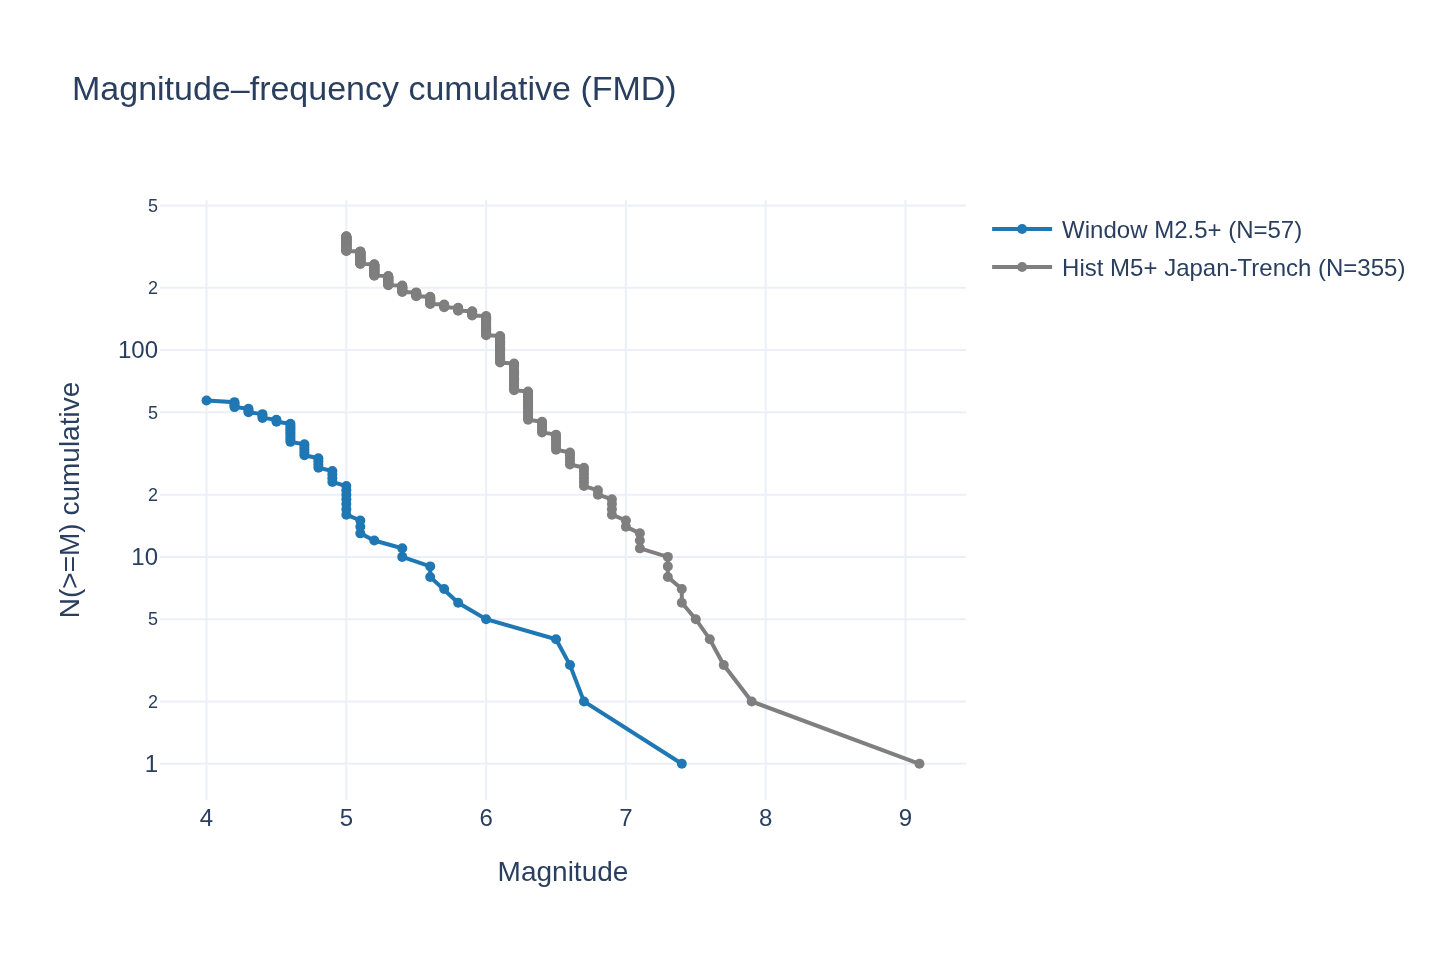
On 2026-05-15 a M6.6 earthquake struck offshore Sanriku, NE Japan (~39.03N, 141.81E), in the Pacific-Plate subduction zone where the 2011 Tohoku M9.1 mainshock occurred.
draftMay 2026
V2: Pre-tornadic CAPE evolution from IGRA soundings vs WSPR precursor timing
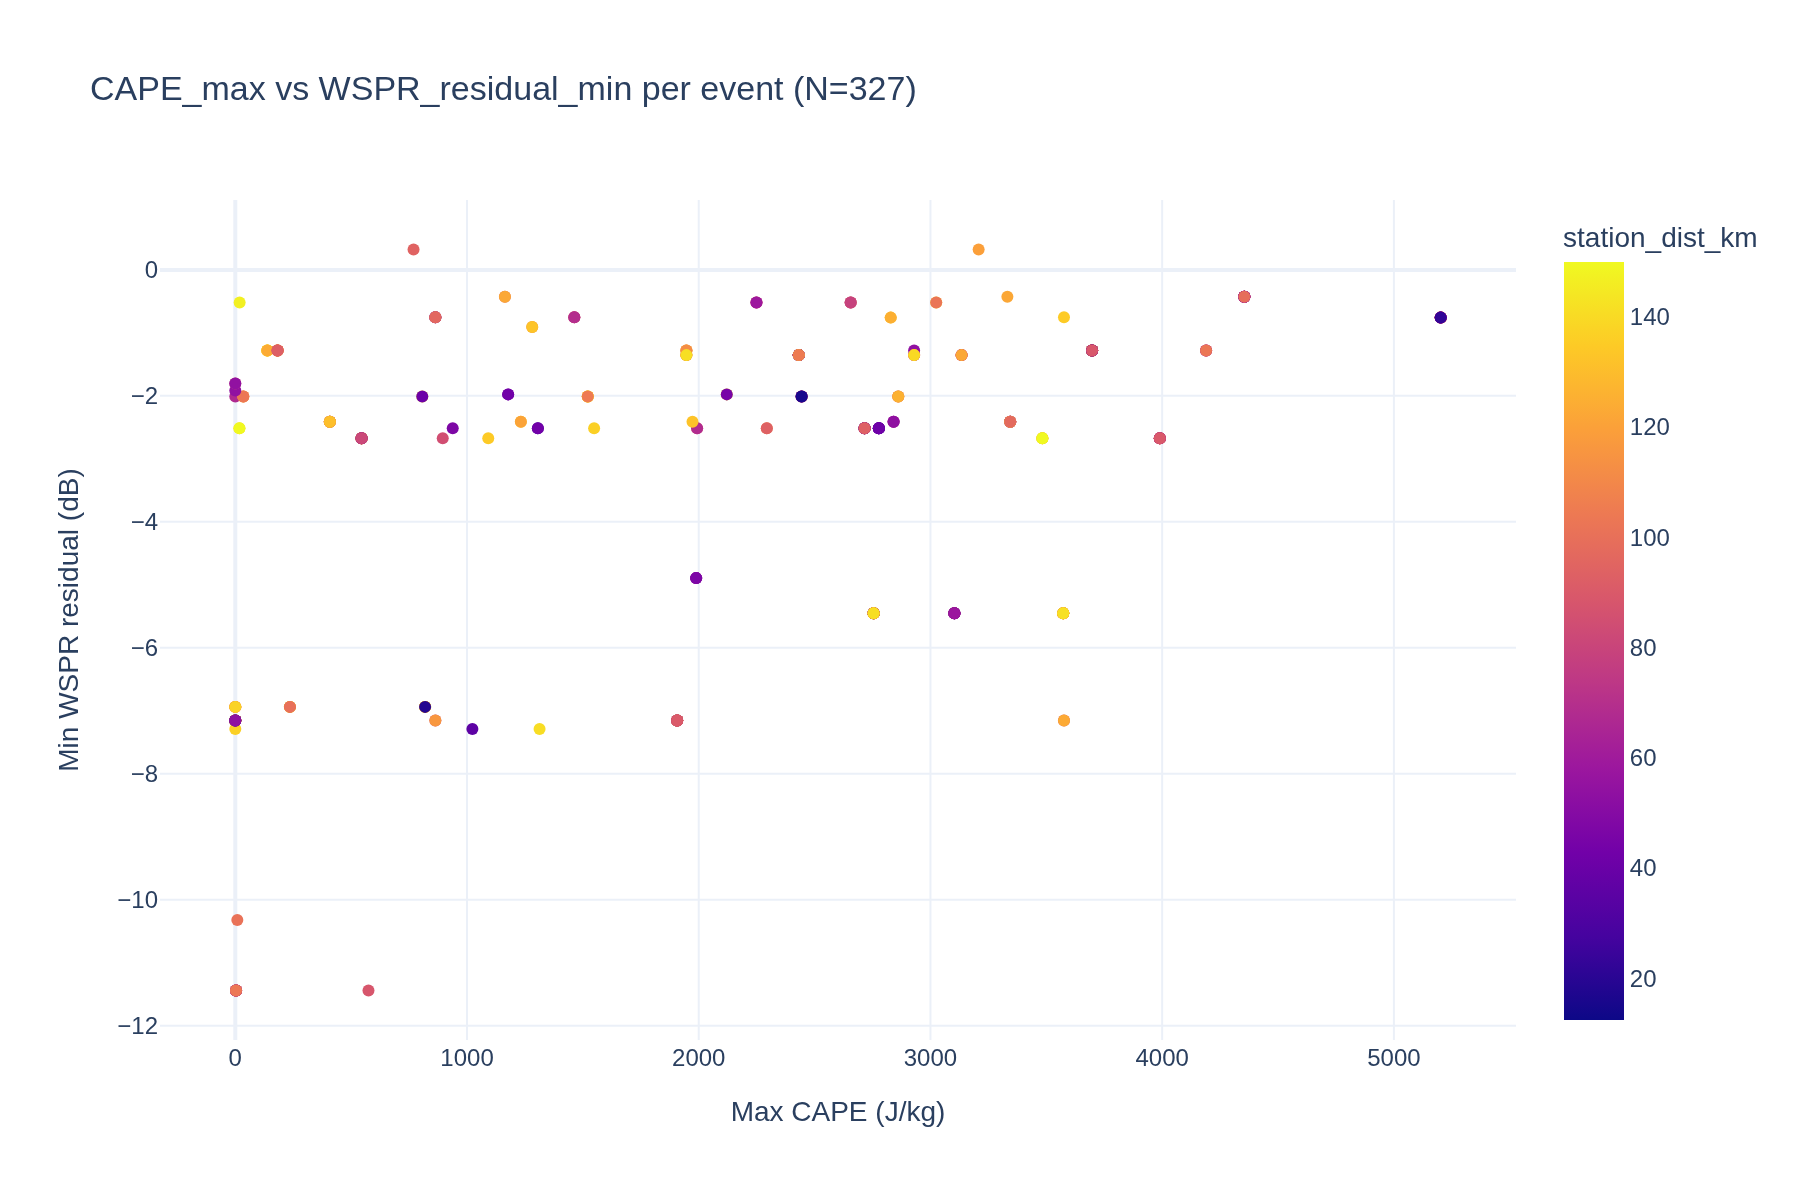
V2 re-run with IGRA sounding data now available (1.2M rows). Test if WSPR 40m precursor timing aligns with CAPE peak timing.
draftMay 2026
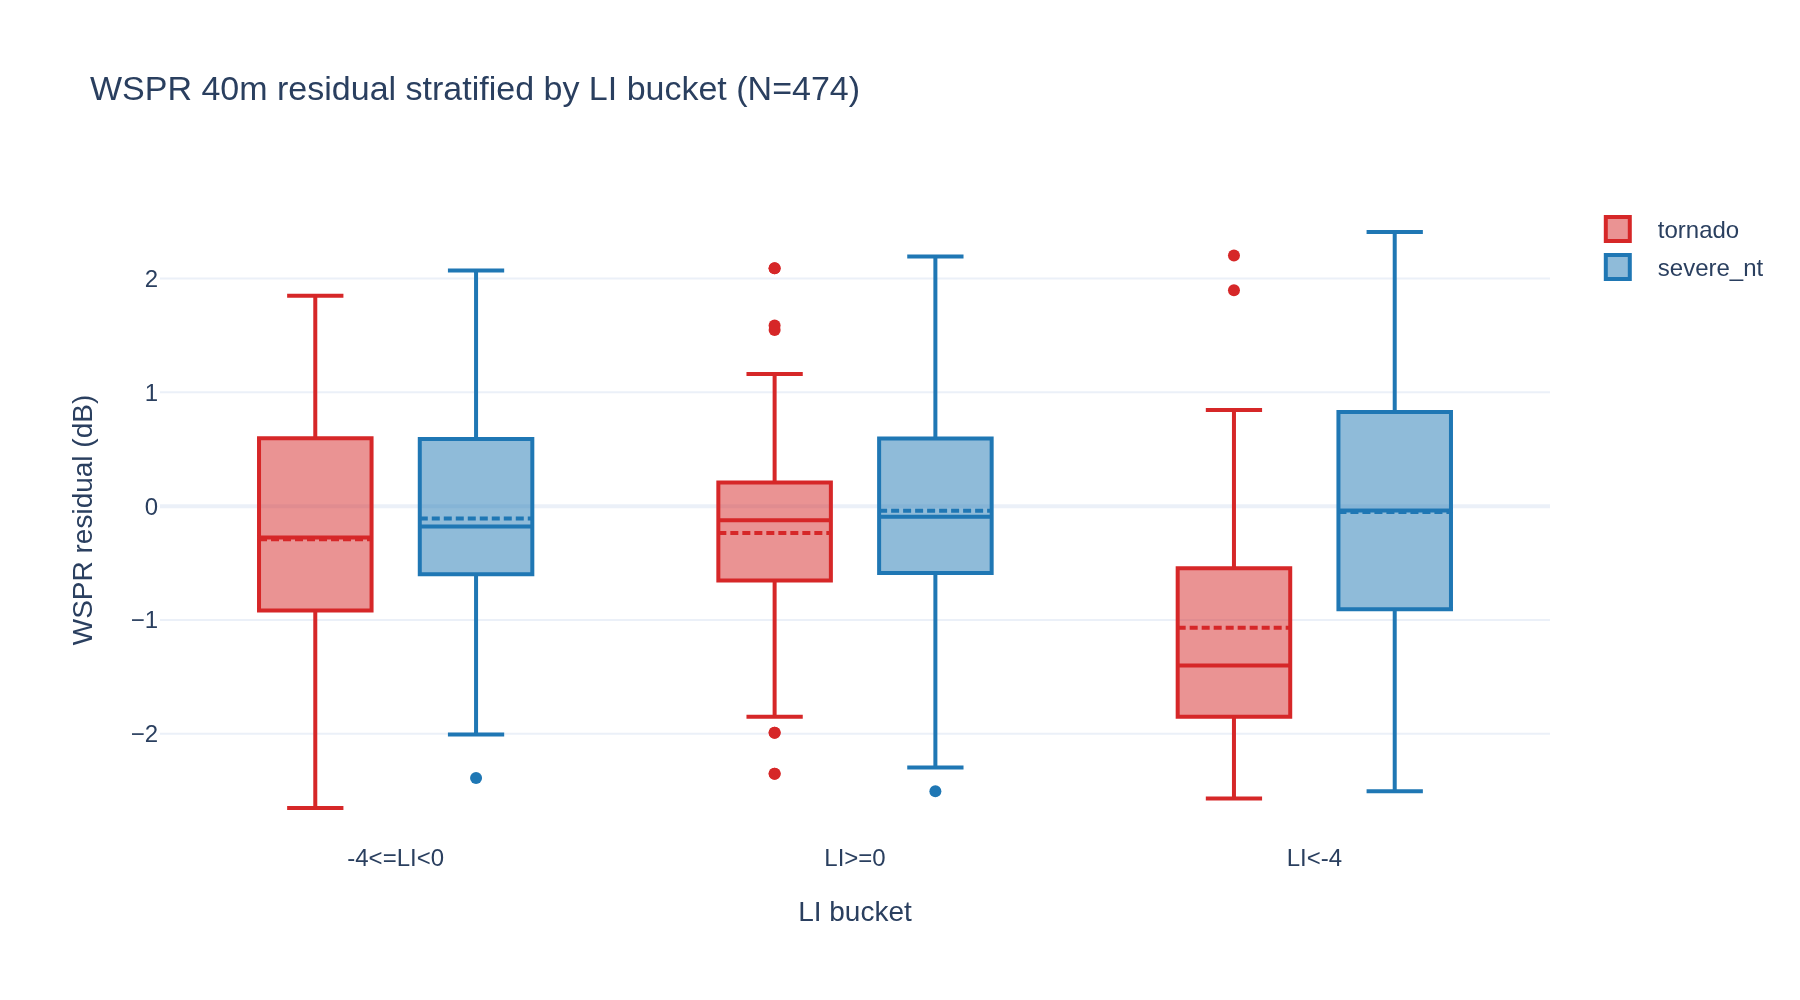
V2: Lifted Index as a control variable for the WSPR-tornado precursor
V2: re-run with full IGRA data (1.2M rows) and live WSPR. Test whether WSPR 40m precursor is independent of LI or proxy.
Space weathercompleteApr 2026
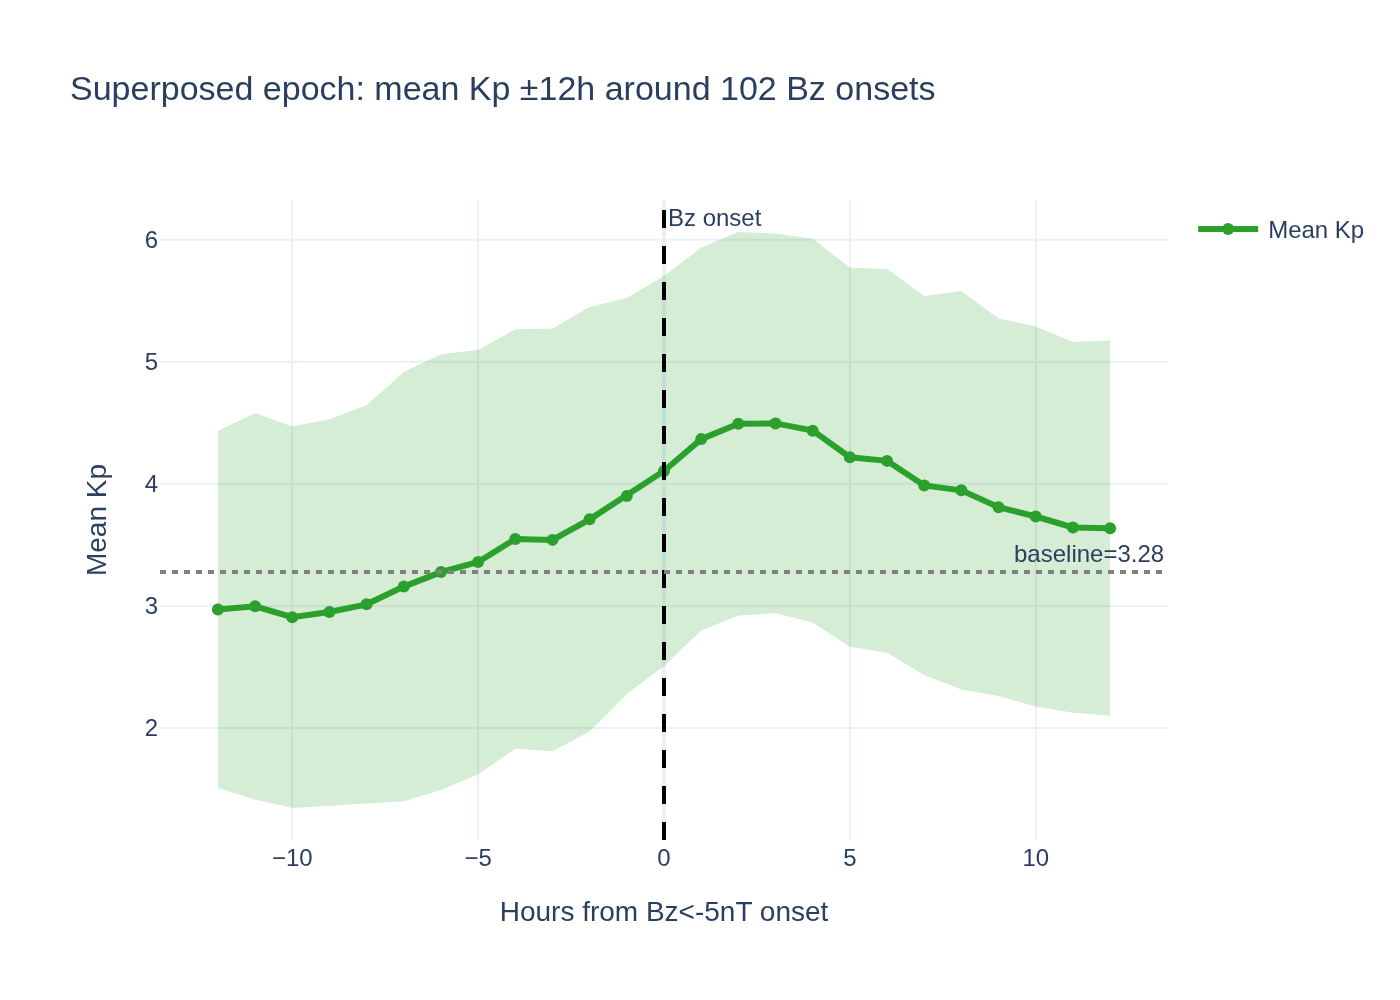
Solar Wind to Kp Storm Onset Lag Time Distribution
Research question: What is the empirical distribution of lag times between a southward IMF Bz excursion (DSCOVR L1 measurement) and the resulting Kp index increase indicating geomagnetic storm onset?
HydrologycompleteApr 2026
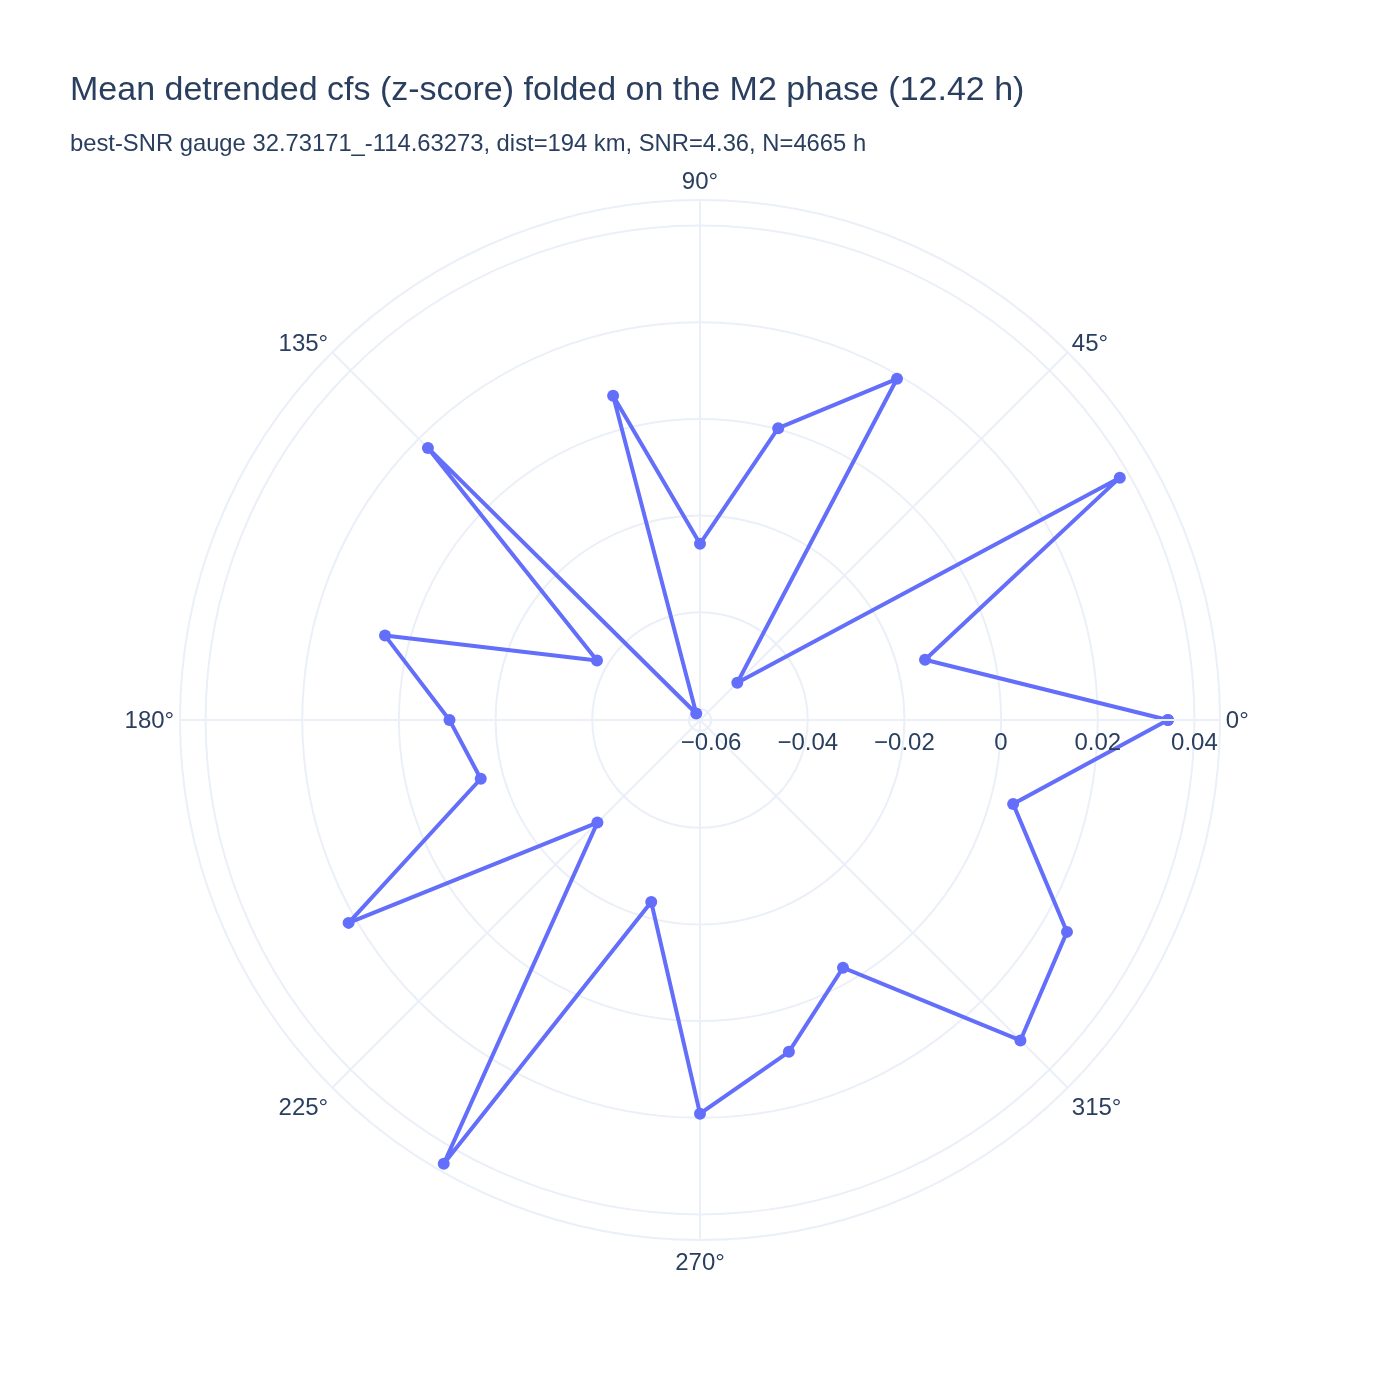
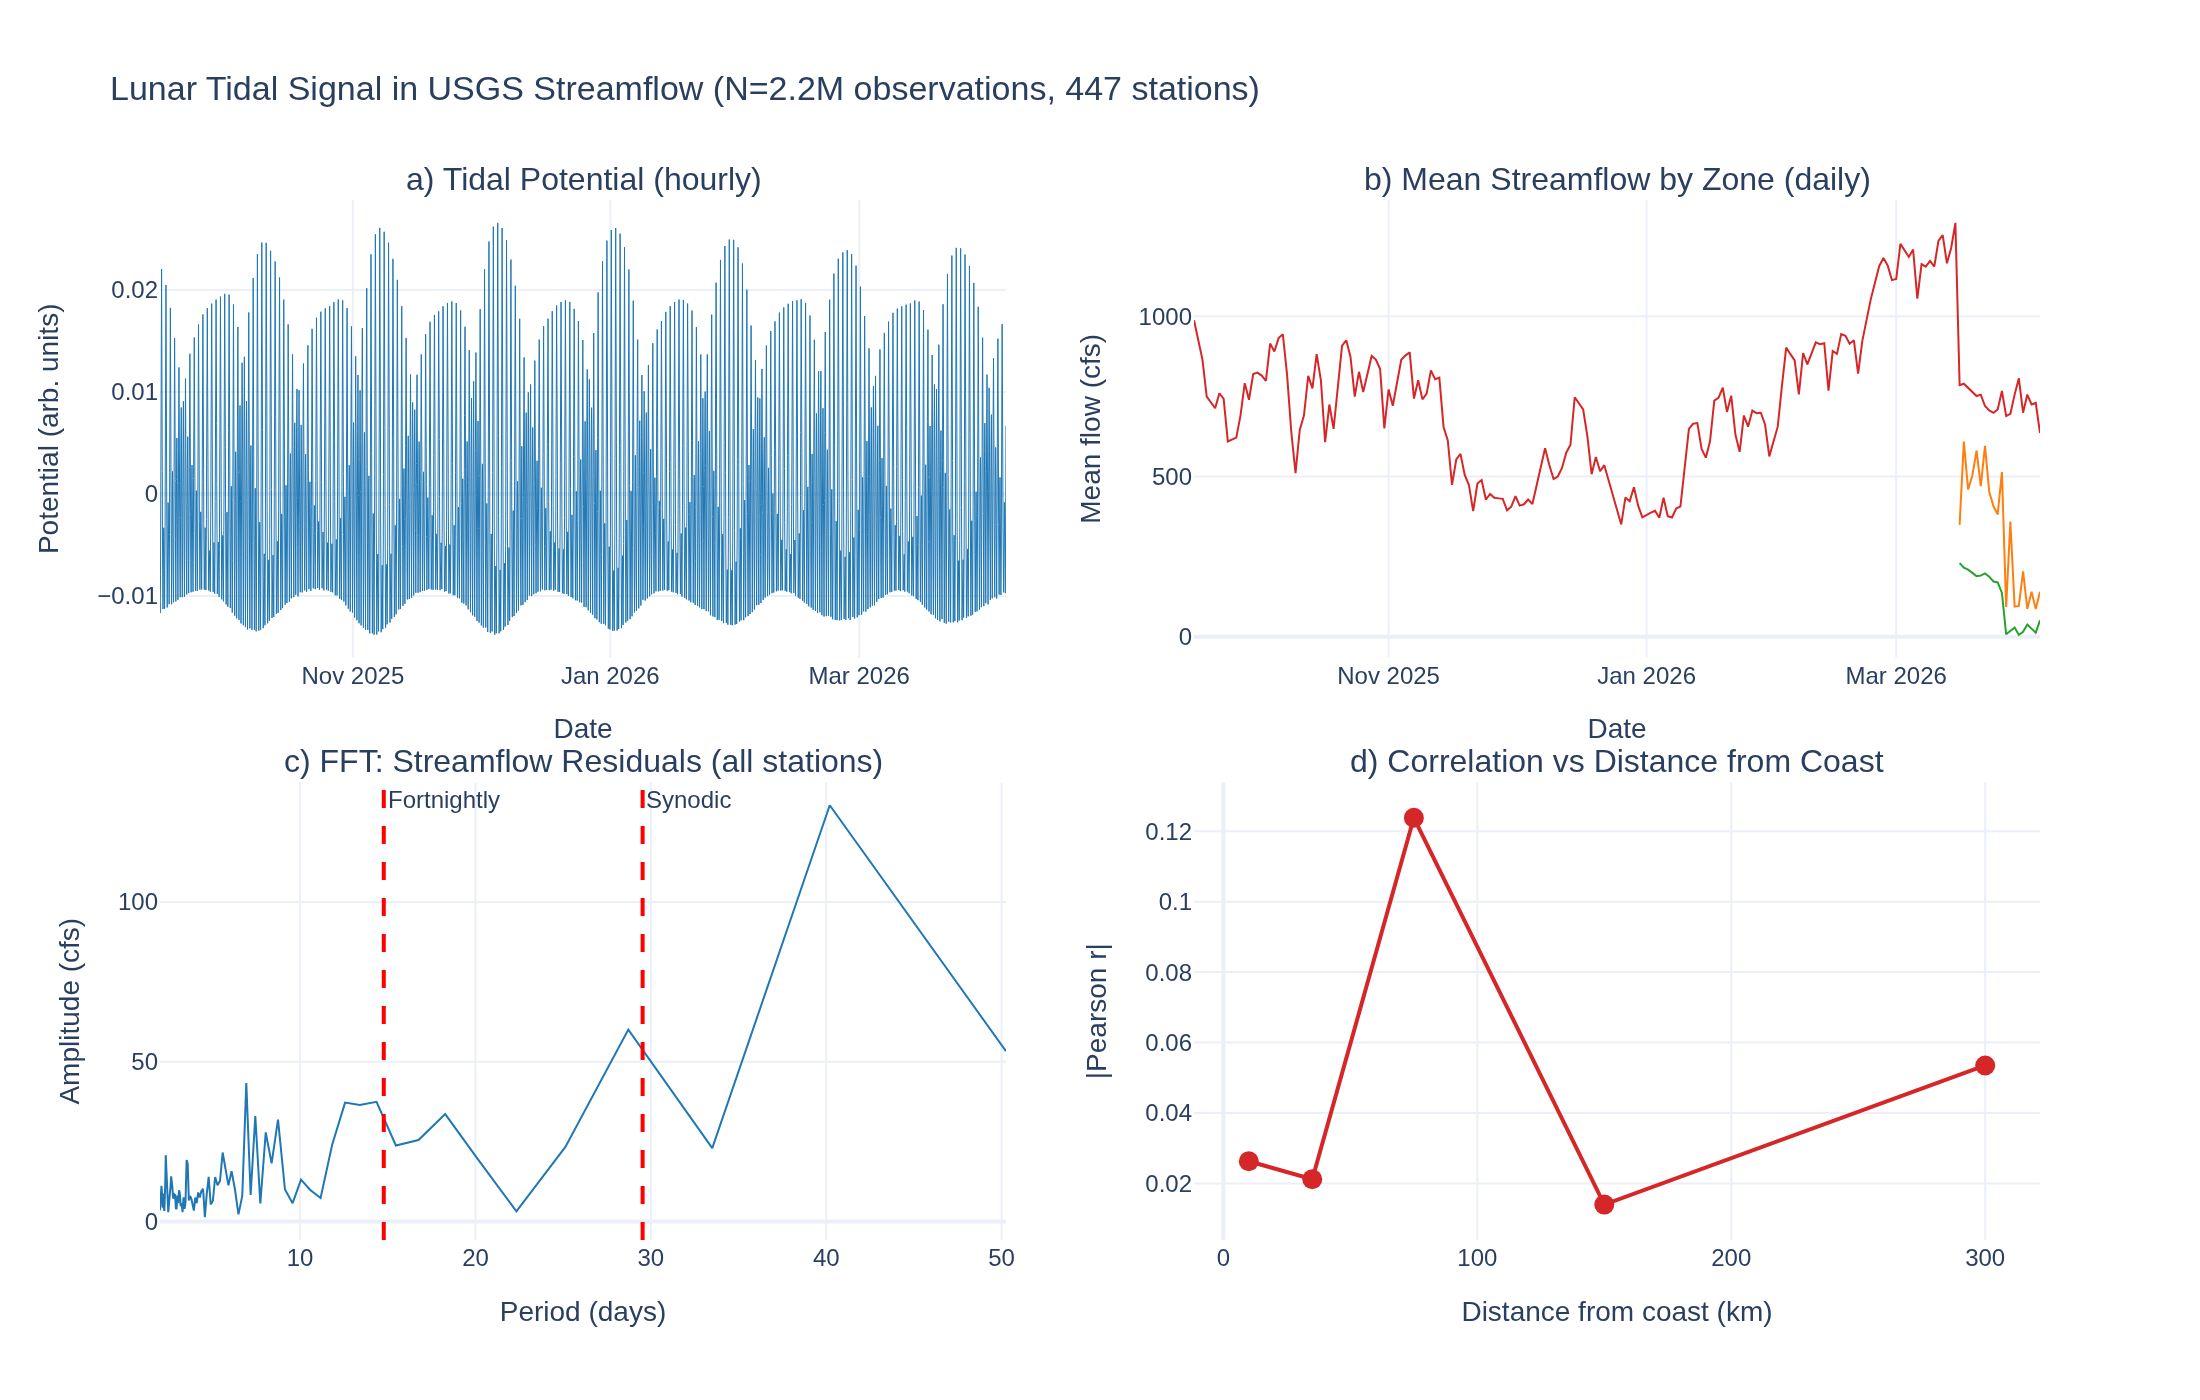
Lunar Tidal Forcing Signature in USGS Streamflow
Does the lunar gravitational tide produce a detectable periodic signal in inland river streamflow at M2 period (12.42h)?
SeismologyactiveApr 2026
April 2026 Offshore Washington Swarm: Ridge, Not Subduction Zone
Fact-check of claims that an earthquake swarm off Washington coast is occurring in the Cascadia Subduction Zone. USGS data shows the swarm at ~129°W on the Juan de Fuca Ridge, ~400 km west of the CSZ trench.
SeismologydraftApr 2026
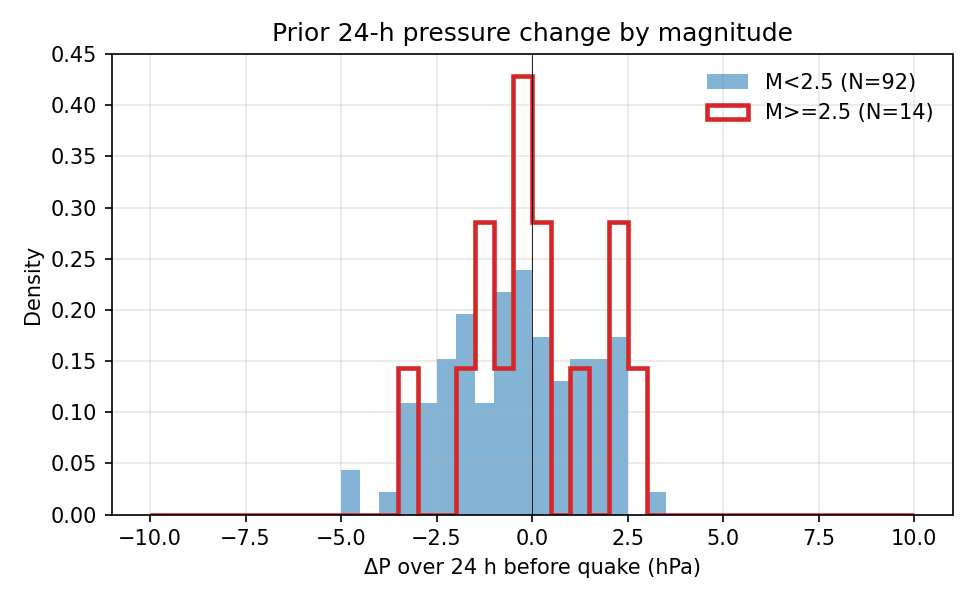
Earthquake-Weather Coupling: Barometric Pressure Trigger Hypothesis
Test whether rapid drops in atmospheric pressure trigger small earthquakes. The folk-science hypothesis says storm fronts reduce confining stress on shallow faults and should elevate seismicity by 0.1-1%. Controlled studies generally find no effect.
Cross-domaindraftApr 2026
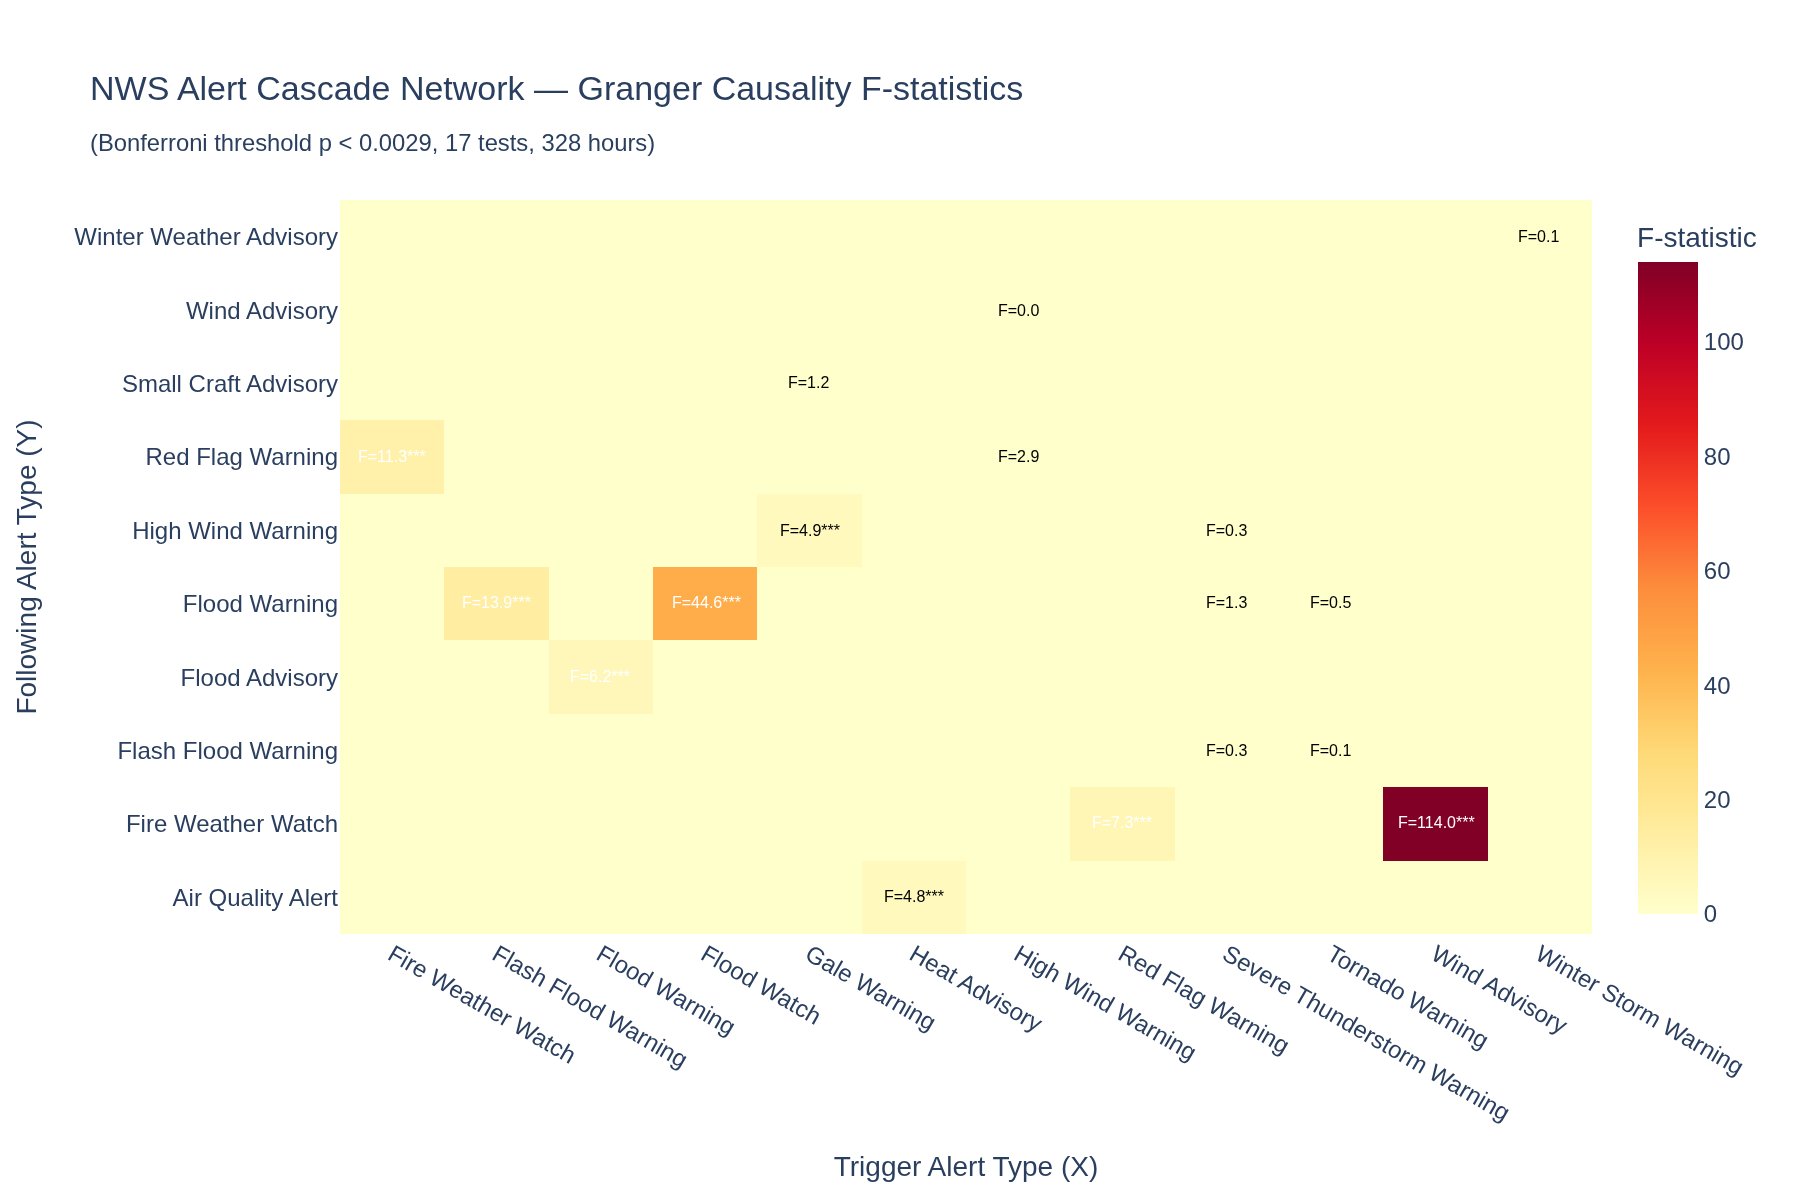
NWS Alert Cascades: Cross-Domain Temporal Prediction Networks
Do flood warnings predict landslide advisories? Do heat advisories predict air quality alerts? Build a temporal cascade network from the NWS alert stream.
Space weatheracceptedApr 2026
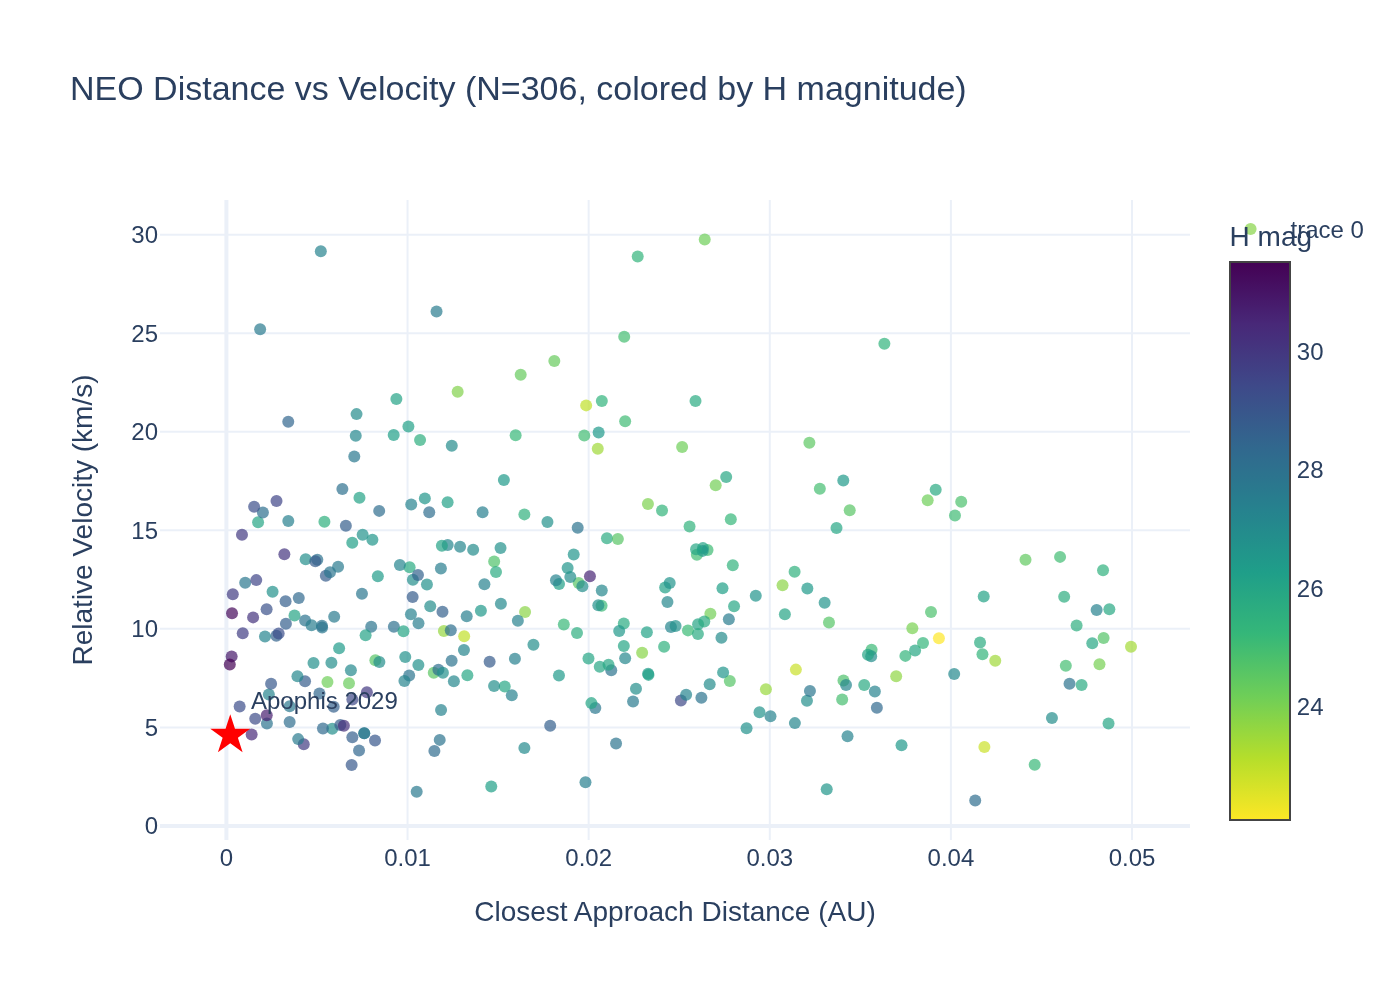
NEO close approaches: flyby distance/velocity patterns and fireball correlation
Do near-Earth object close approach patterns correlate with fireball events? Are there temporal clusters in flyby distance or velocity?
HydrologyacceptedApr 2026
Lunar tidal signal in inland rivers: gravitational forcing on USGS streamflow
Can we detect a lunar tidal signal in inland river streamflow? The gravitational tidal force acts on all mass, not just oceans, but the effect on rivers should be extremely small.
SeismologyacceptedApr 2026
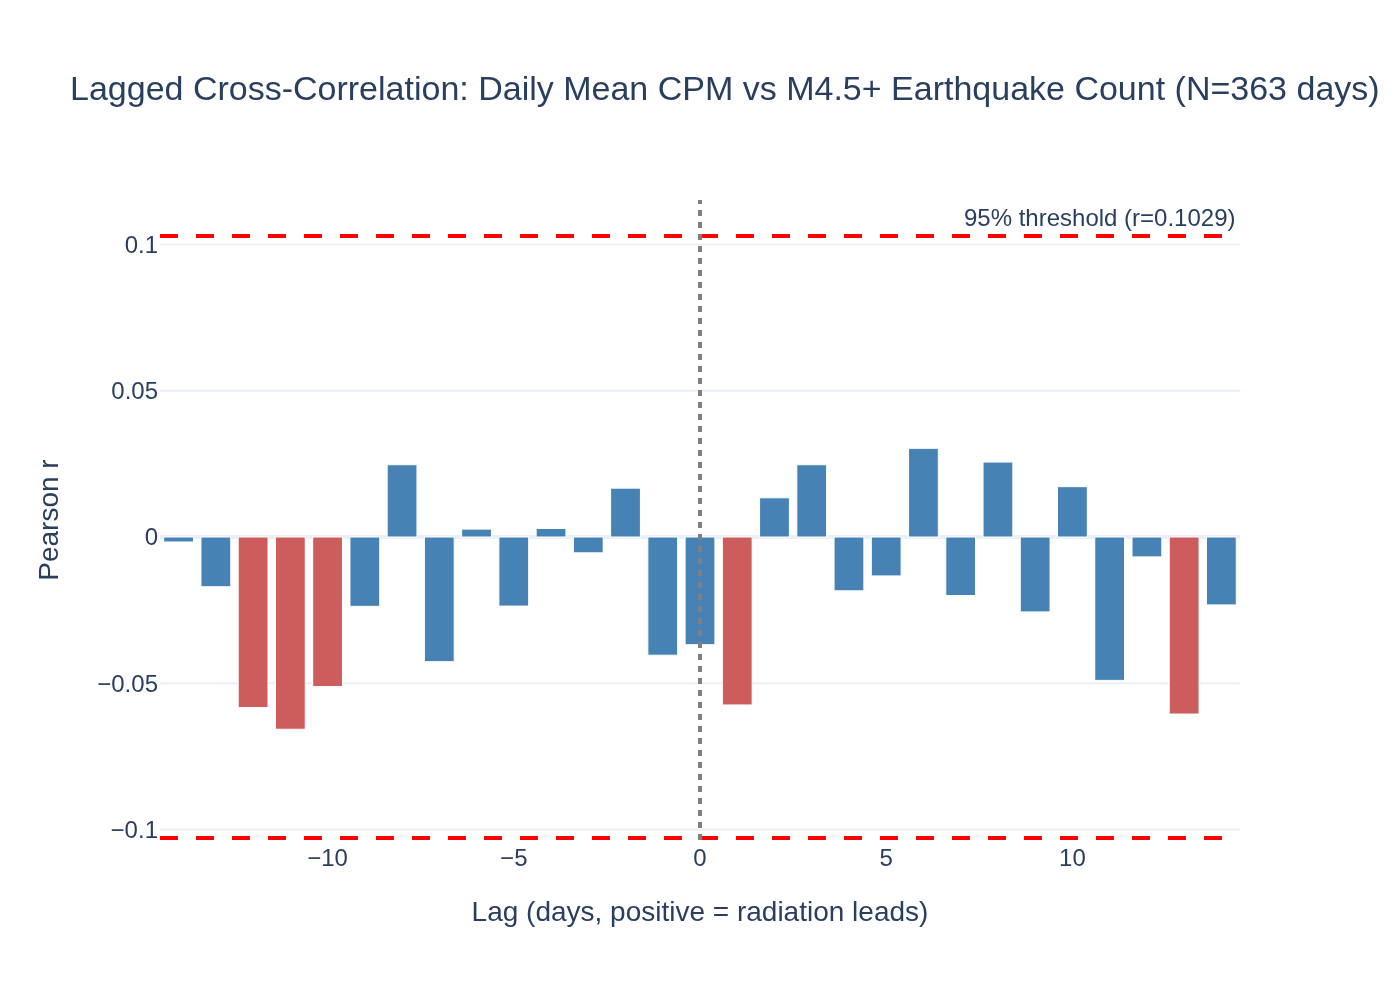
Radon precursor hypothesis: Safecast radiation vs earthquake timing
Does background radiation (Safecast citizen-science network) show detectable anomalies in the days before significant earthquakes?
ClimatedraftApr 2026
ENSO-Severe Weather Coupling: NWS Alerts vs El Nino/La Nina Phases
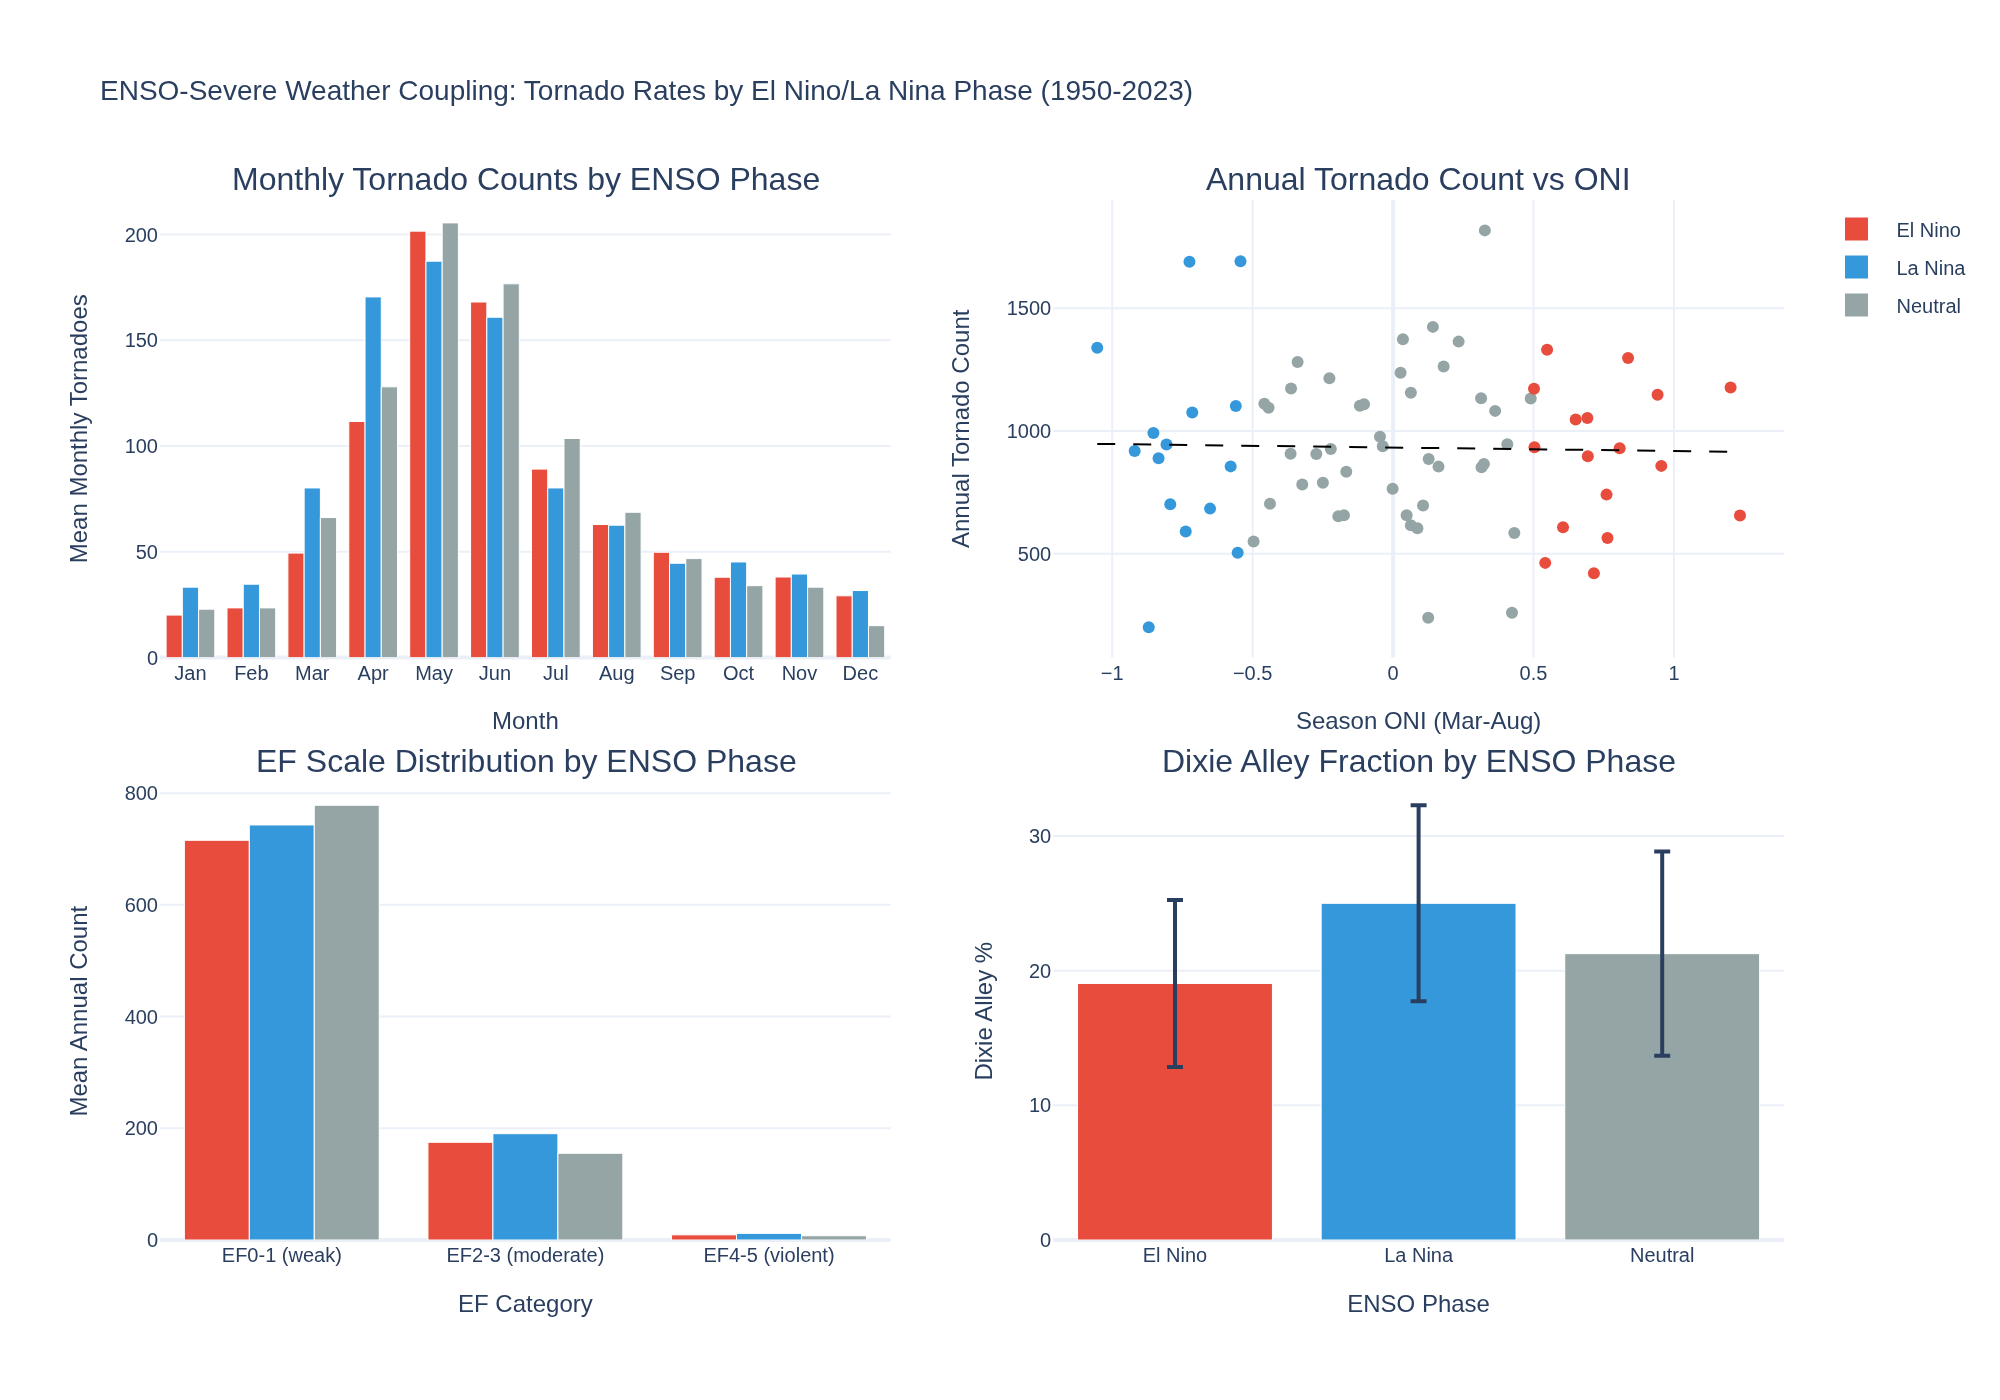
Does ENSO modulate NWS alert rates? Monthly alert counts stratified by ONI phase. La Nina → more tornadoes? El Nino → more floods? Fire weather vs drought index.
RadiationacceptedMar 2026
DONKI Event Catalog: Cascade Triggers in the Sun-to-Ground Chain
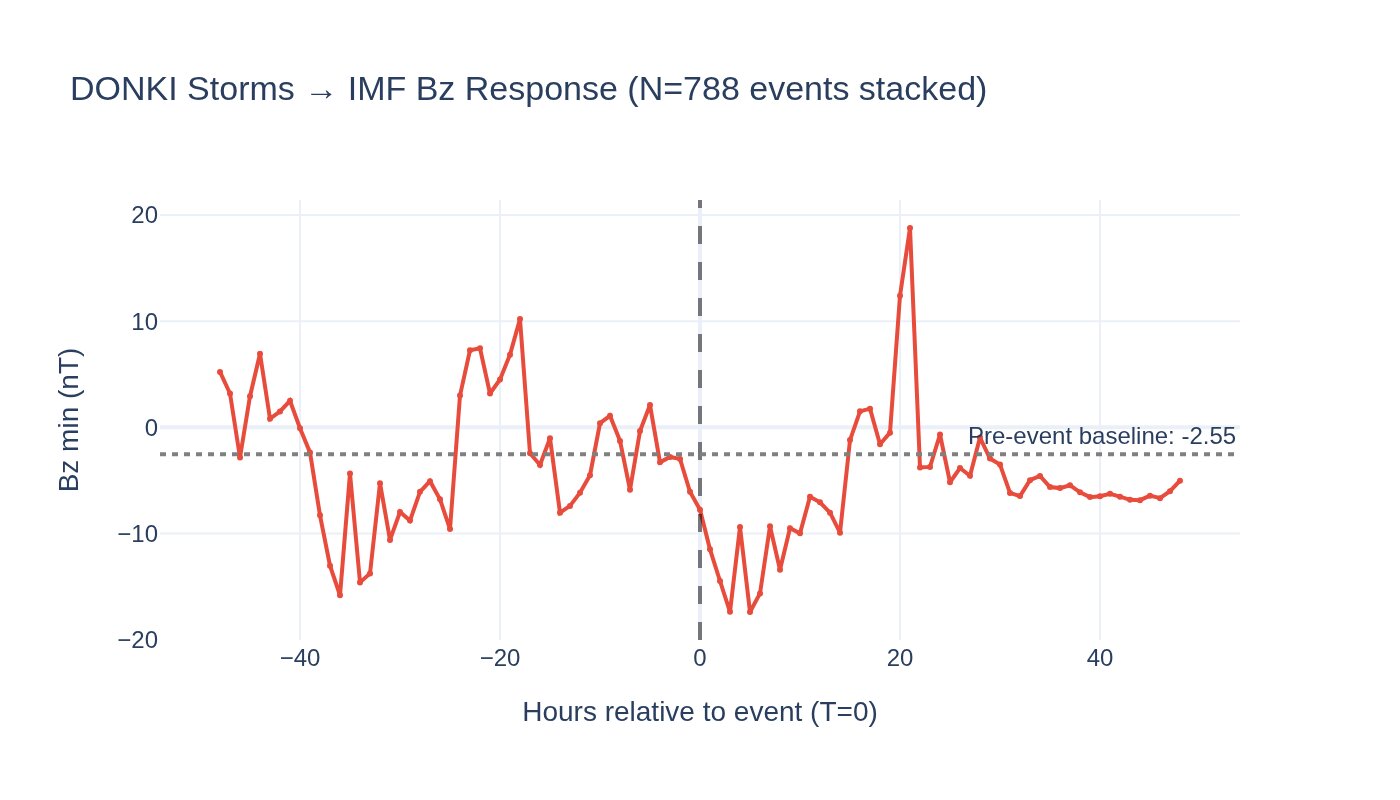
SEA of 1,809 DONKI events: storms peak Kp at T+6h (+47%), HSS +6%, radiation belt lags by 38h. CME speed negatively correlates with Kp (r=-0.18) due to catalog selection bias.
Cross-domaincompleteMar 2026
NWS Severe Weather Baseline: Alert Patterns and Geographic Distribution
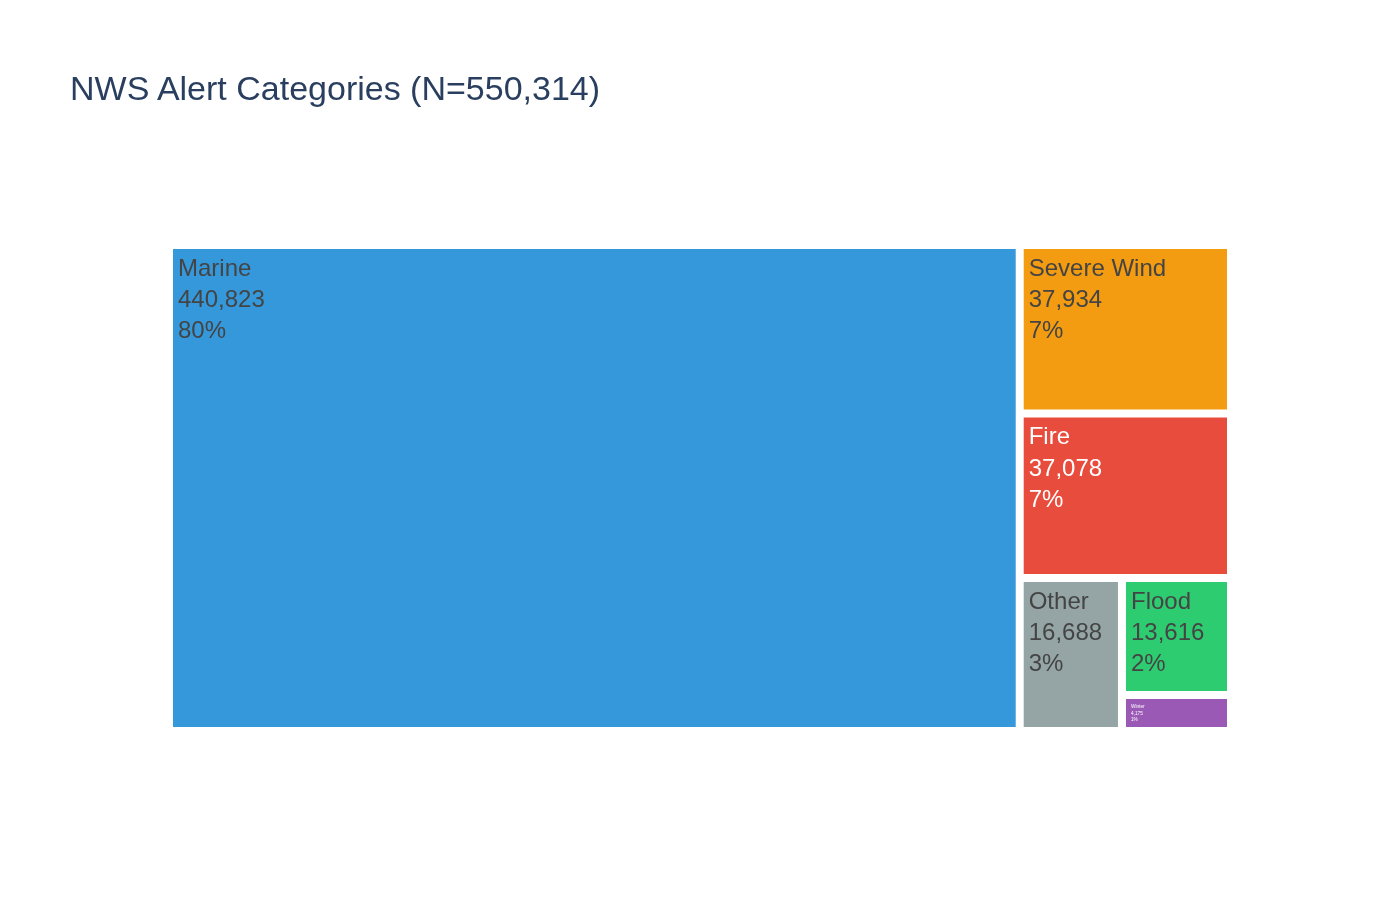
Baseline analysis of 550K NWS alerts (45 types, 8 days) + 69K historical tornado reports (1950-2023). 80% marine, 63x diurnal swing, May tornado peak, Kp cross-domain null. Foundation for dashboard and cross-domain work.
Space weathercompleteMar 2026
X1.5 Solar Flare Watch: March 29, 2026
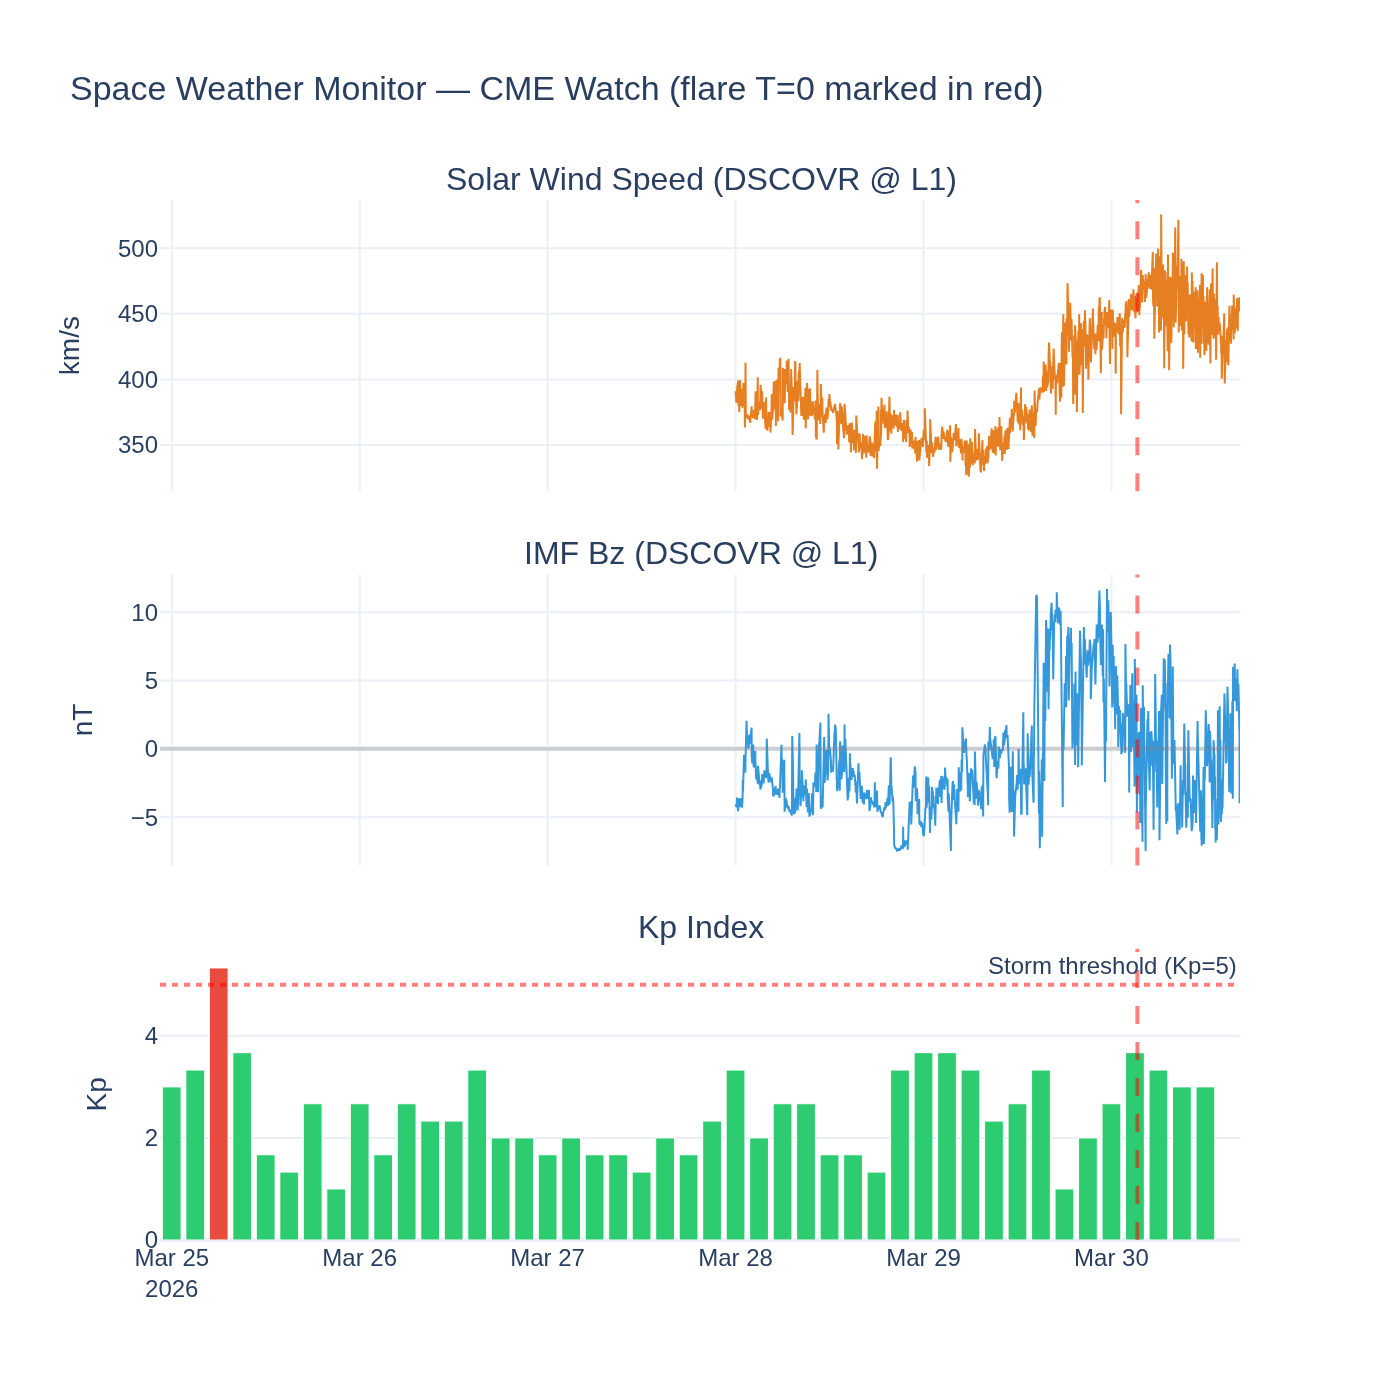
X1.5 flare (largest in 12.6M GOES readings) + 1,845 km/s CME. 6-entry lab notebook tracking the event over 60h. CME did not impact Earth. Successful infrastructure test of 7-stream monitoring pipeline.
SeismologydraftMar 2026
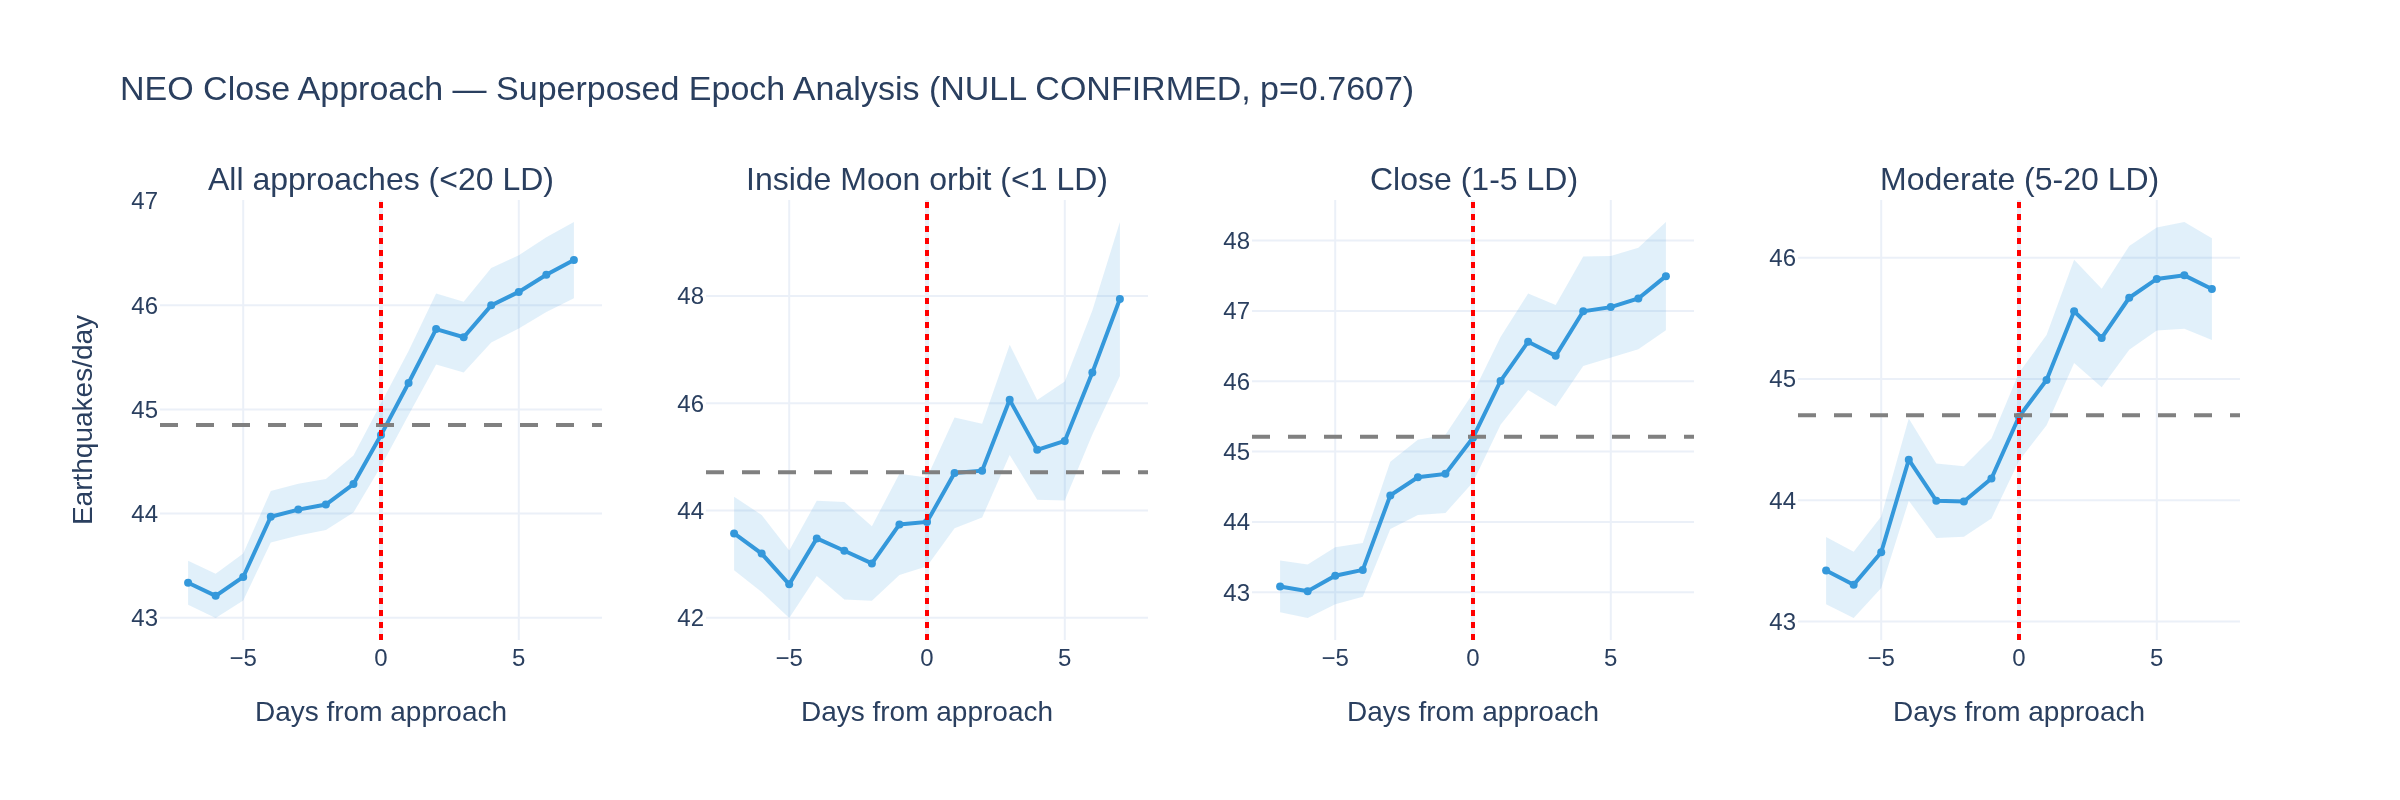
NEO Gravitational Null Test
Superposed epoch analysis: do near-Earth object close approaches produce detectable changes in earthquake rate, Kp, or tides?
draftMar 2026
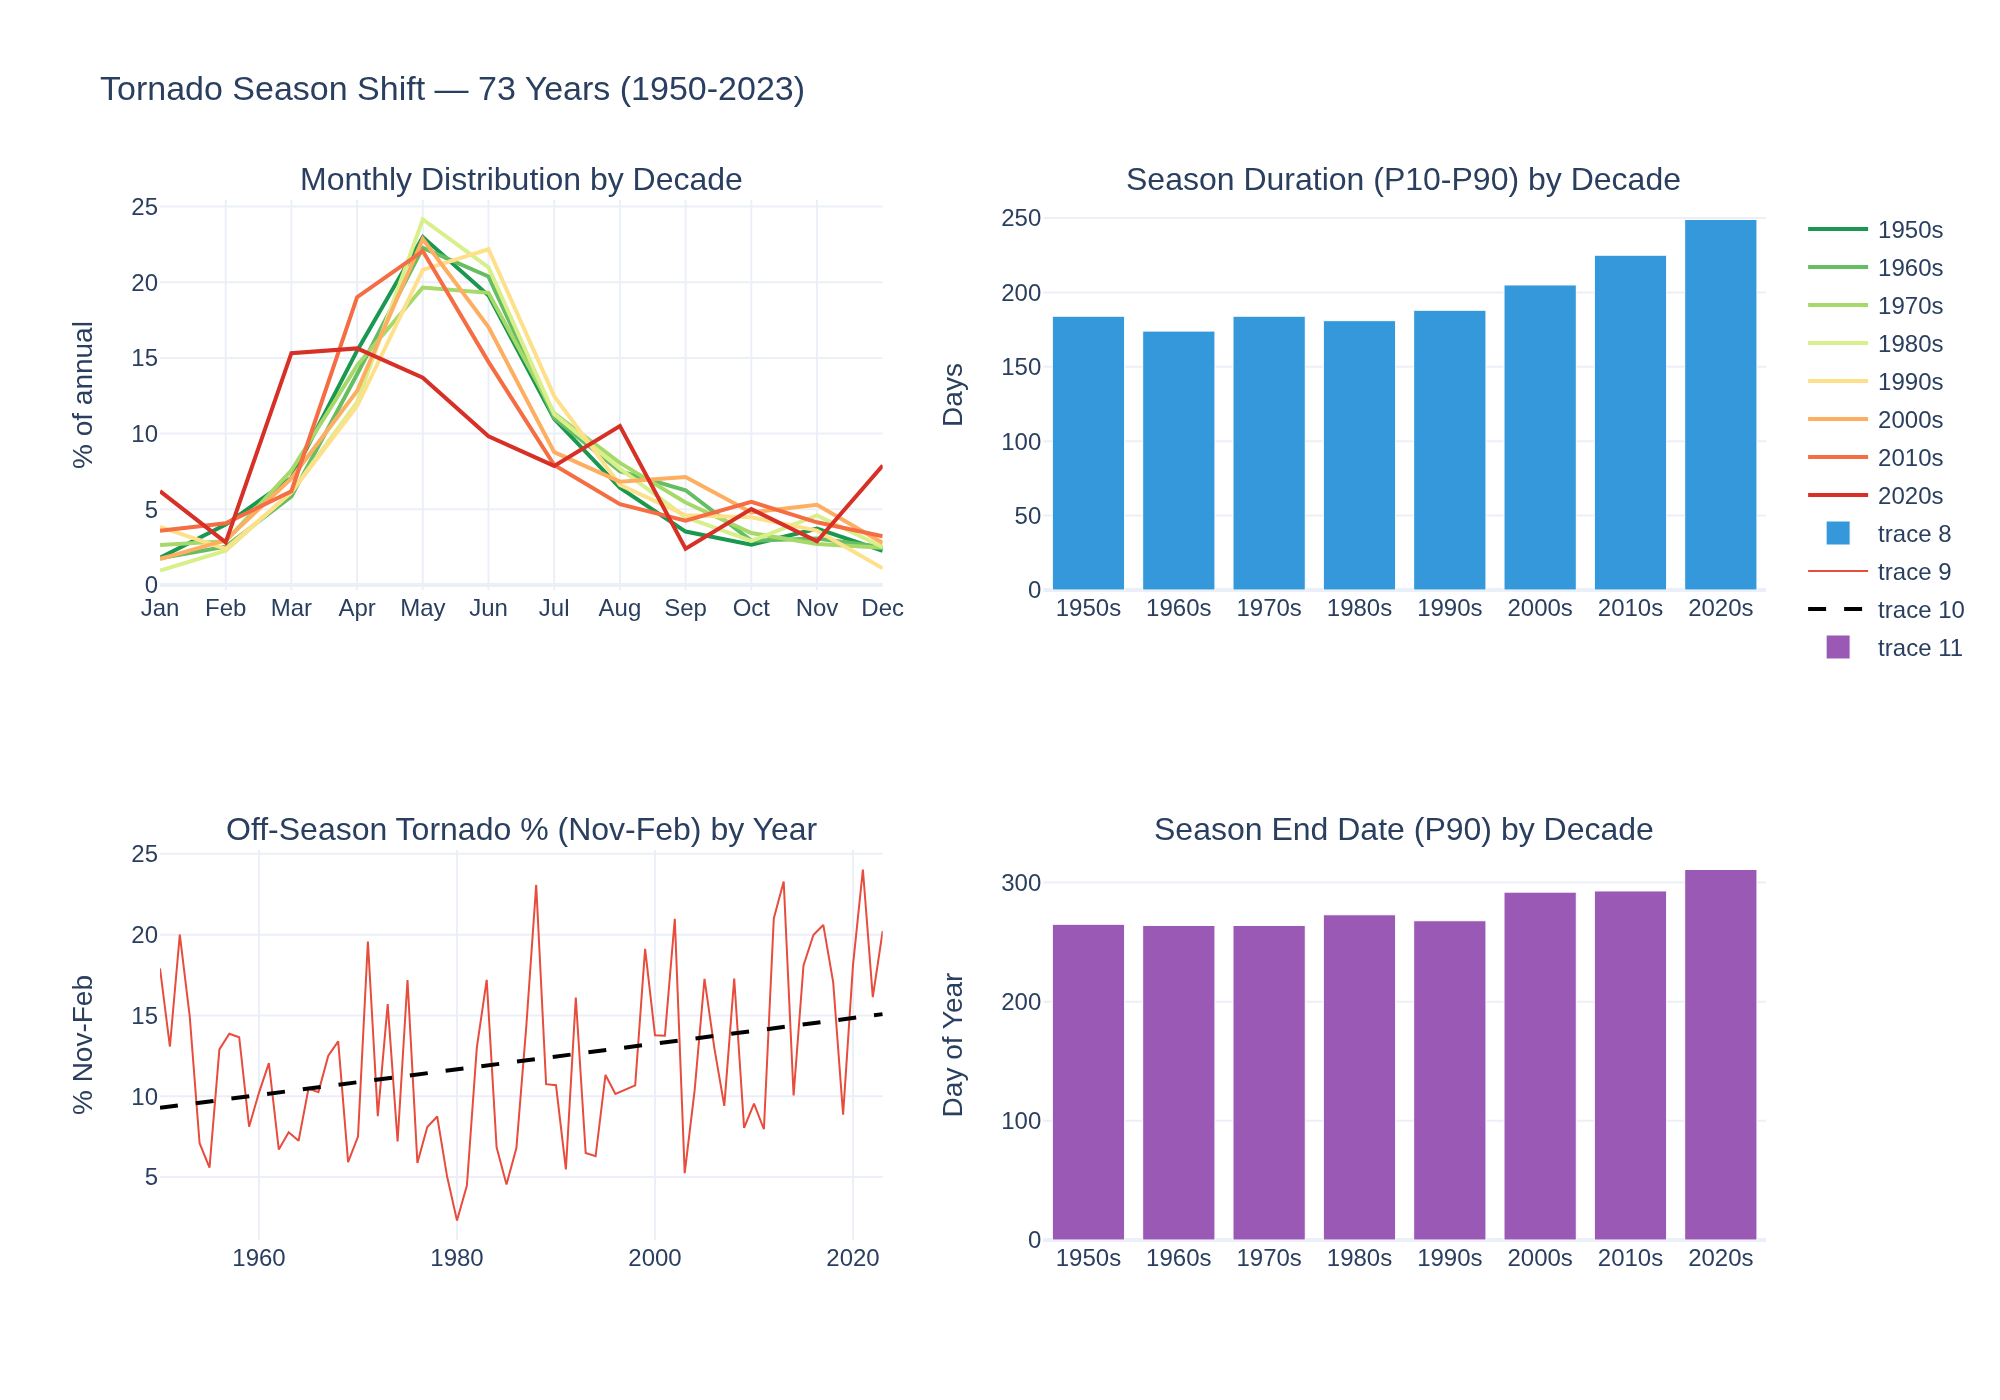
Tornado Season Shift Analysis
Is tornado season extending later into the year? 73 years of SPC data.
Cross-domaindraftMar 2026
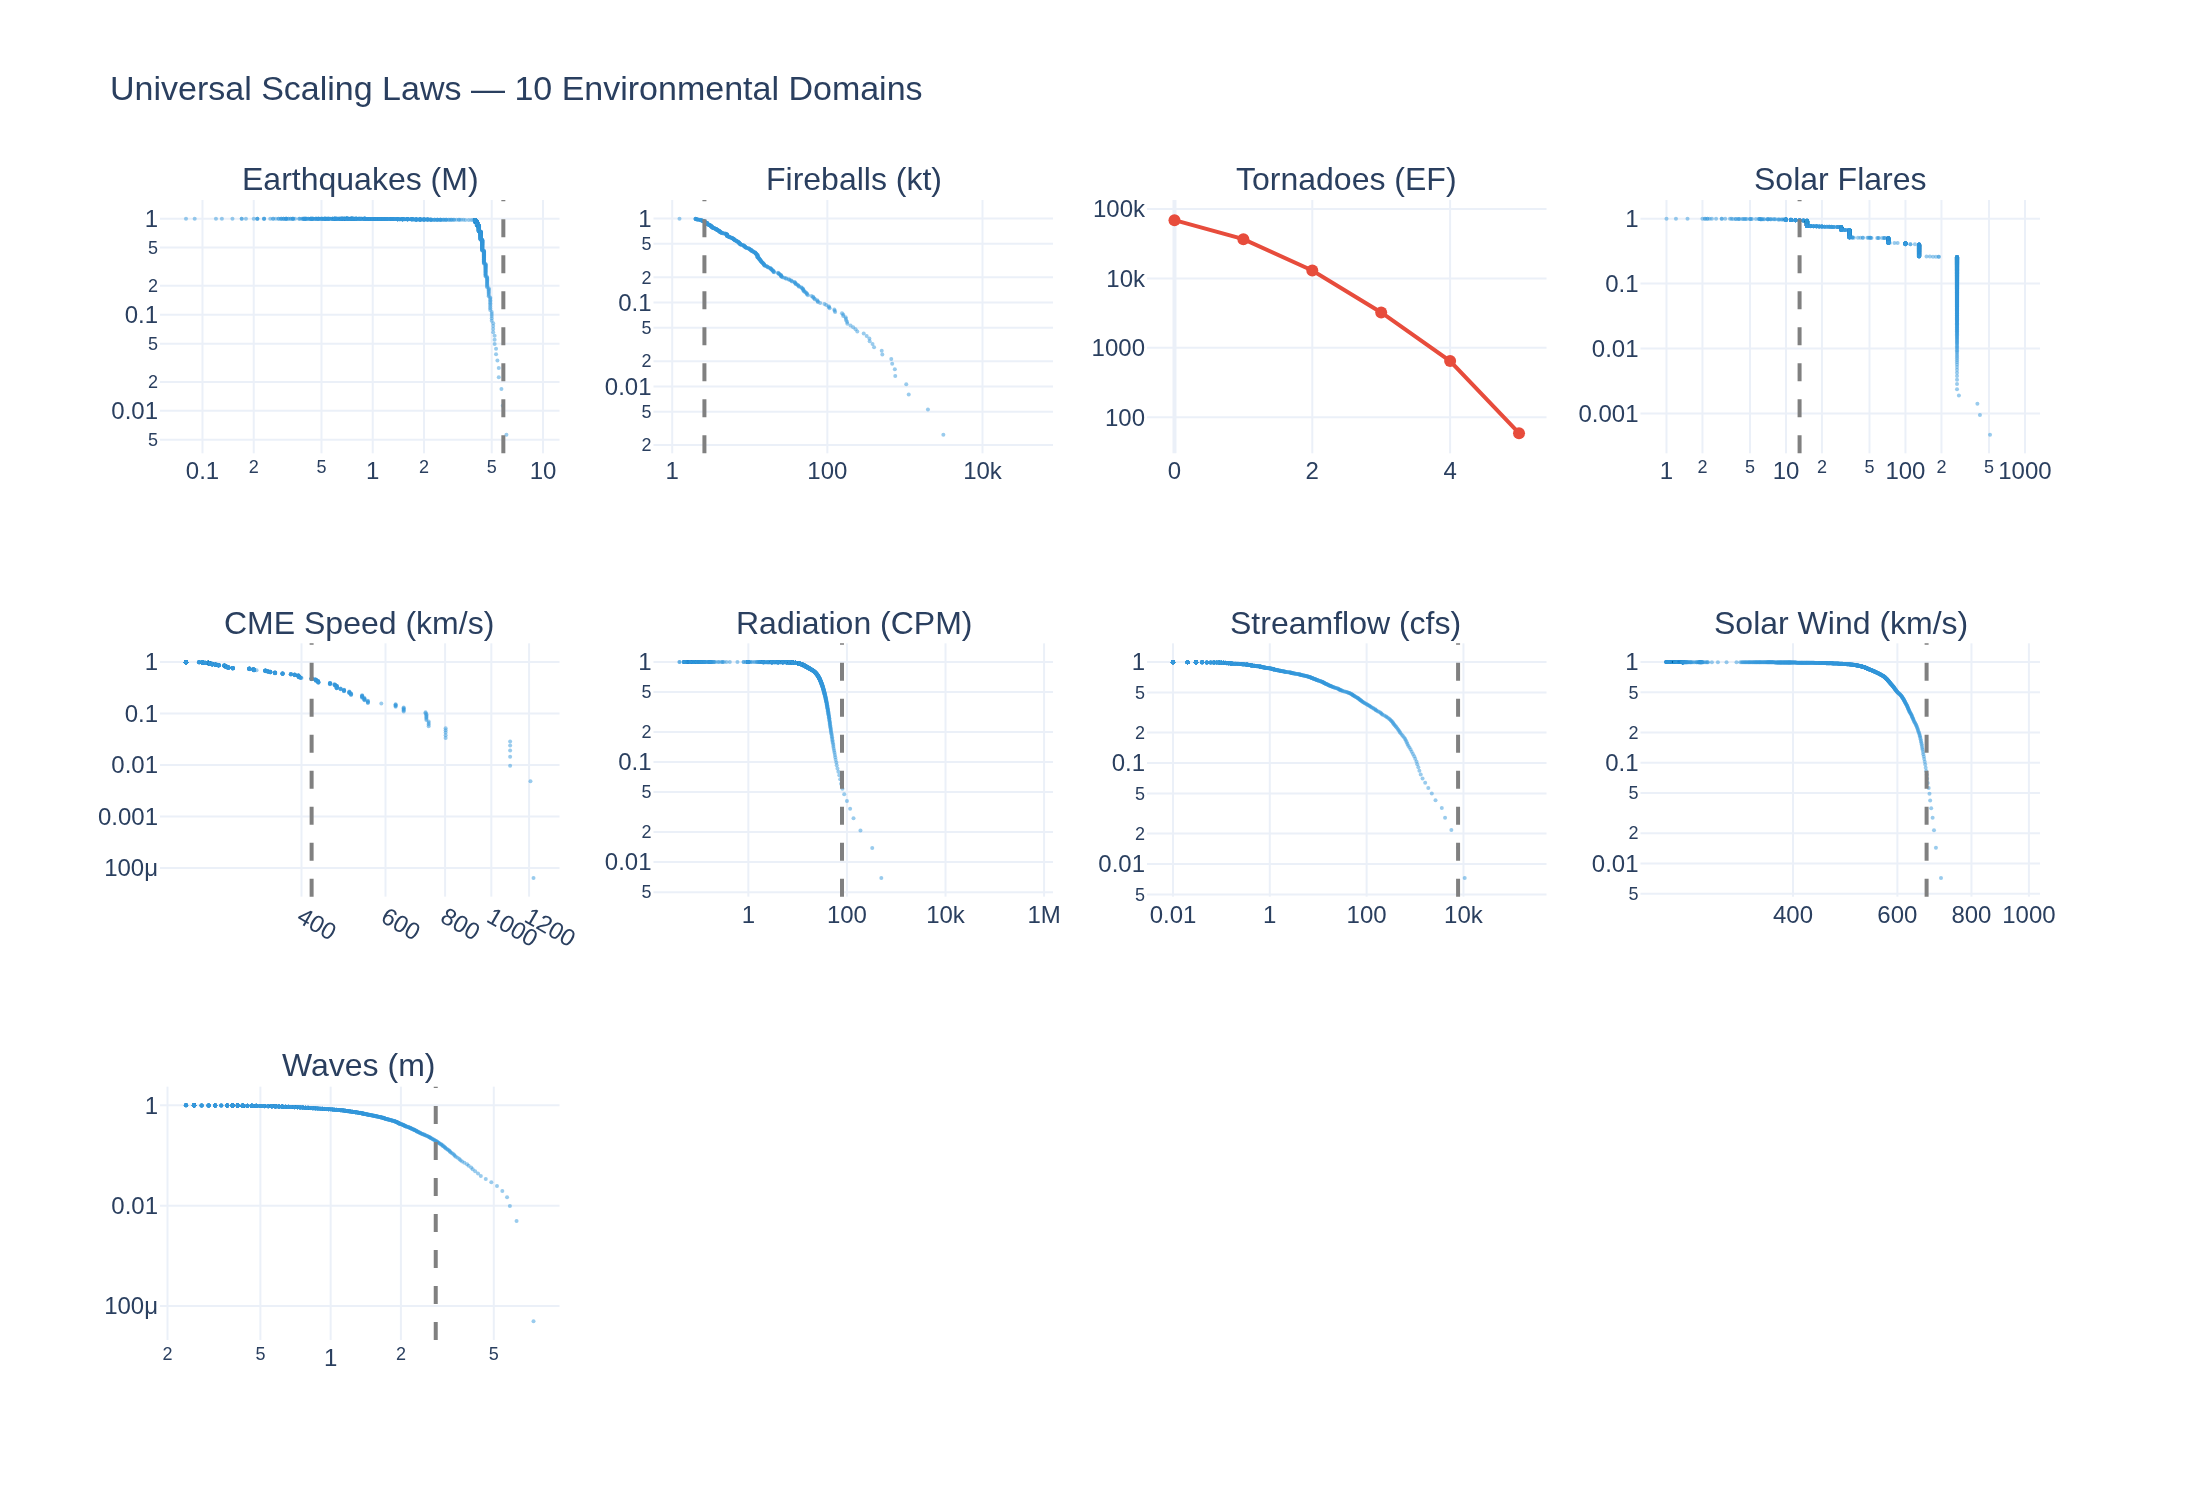
Universal Scaling Laws
Cross-domain distribution analysis: power law vs exponential vs lognormal vs Weibull across 10 environmental metrics
SeismologydraftMar 2026
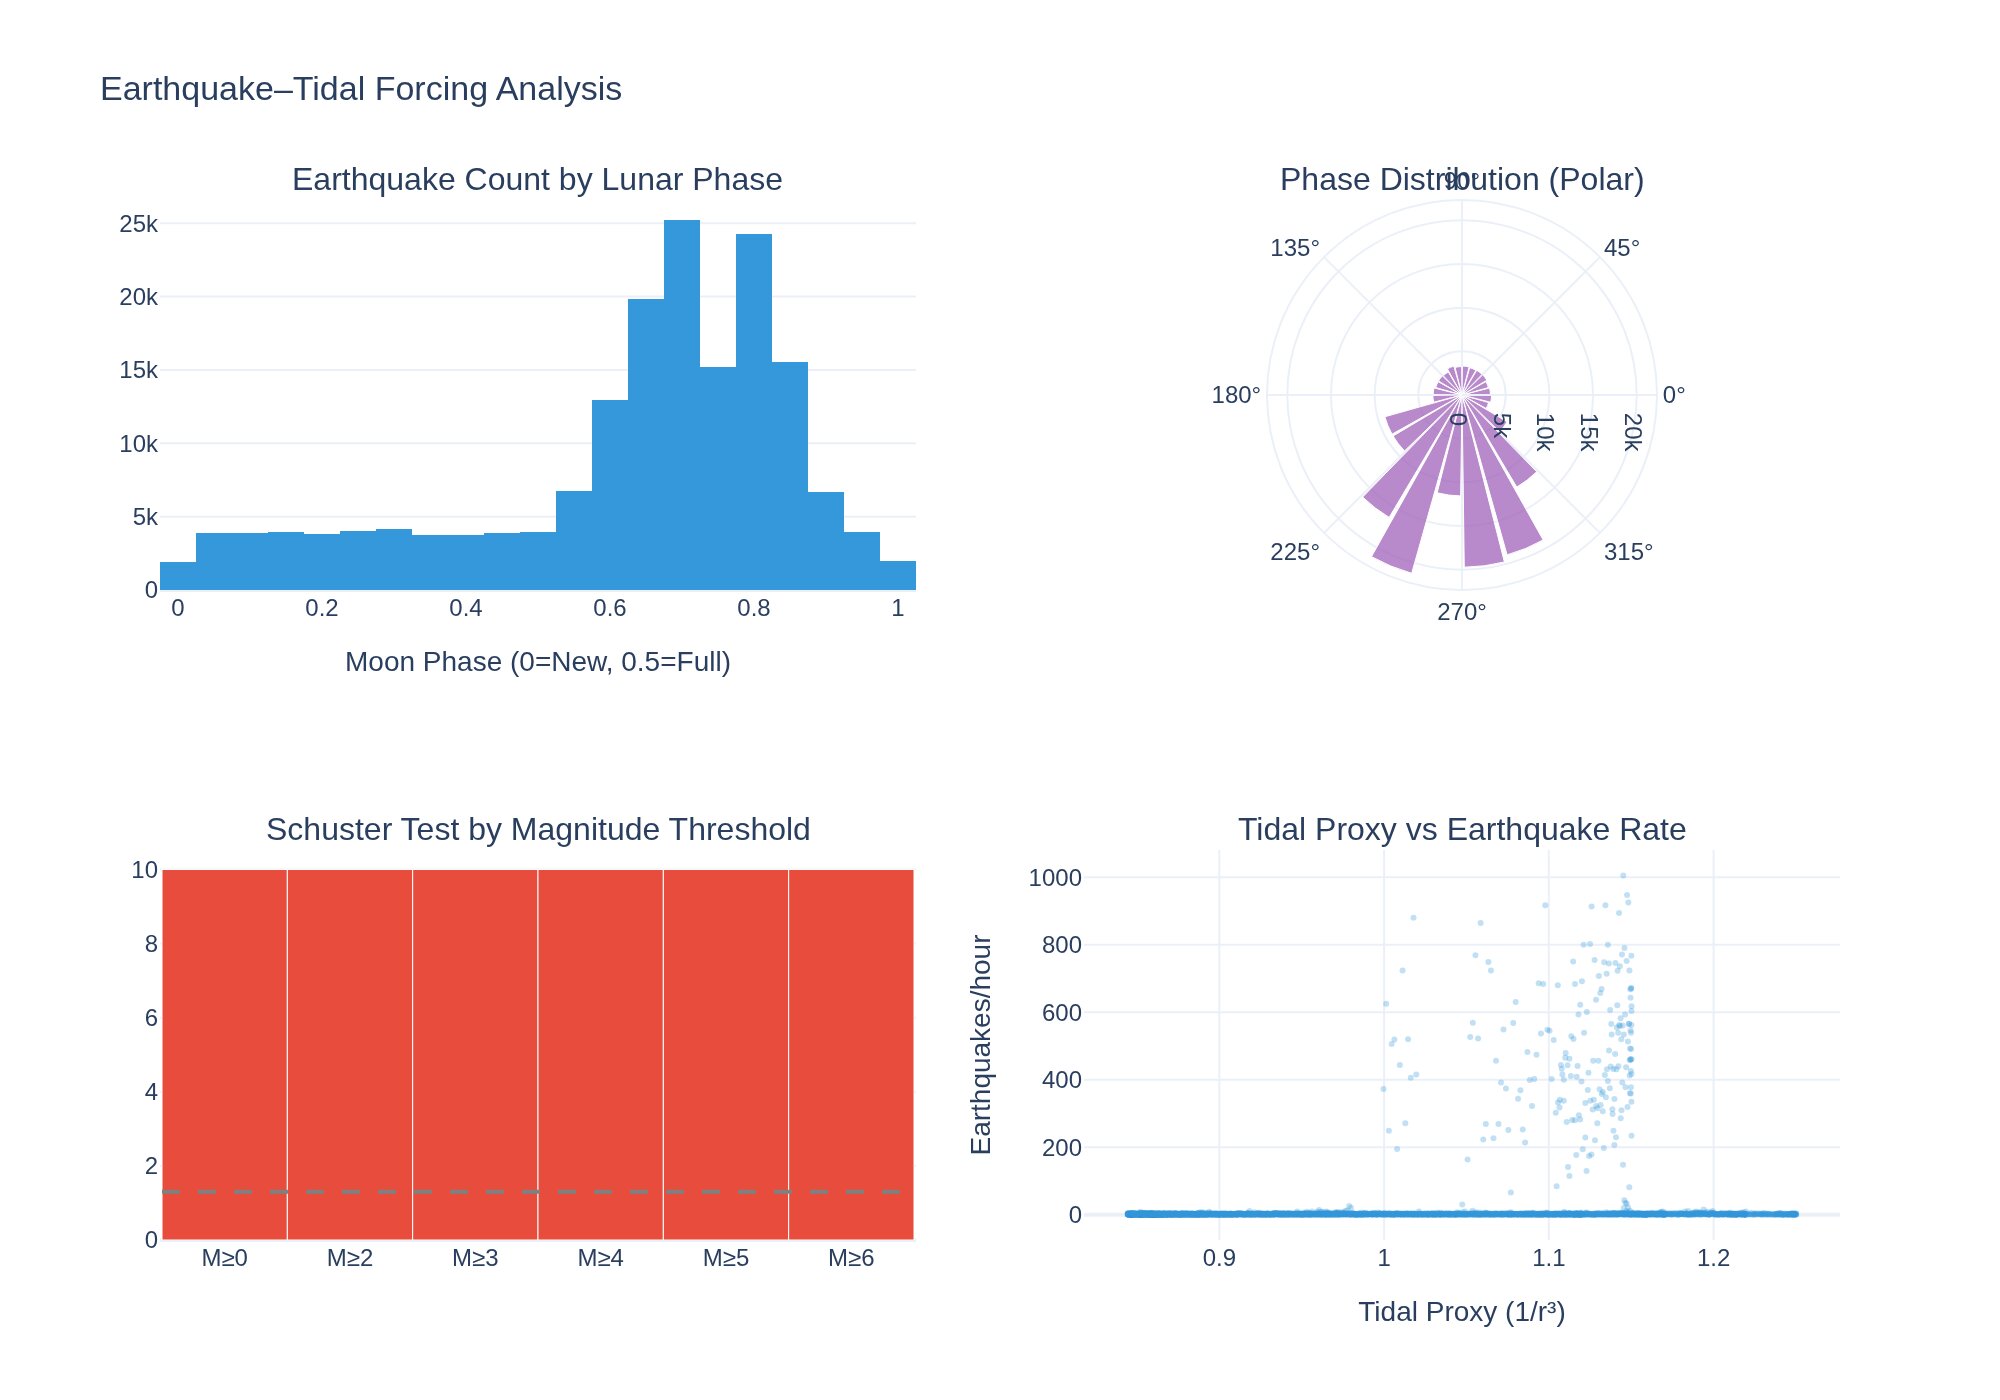
Earthquake–Tidal Forcing
Do earthquakes cluster at Full Moon, New Moon, or lunar perigee? Testing the 1-2% tidal triggering hypothesis with 172K earthquakes and 5K hours of JPL ephemeris.
SeismologydraftMar 2026
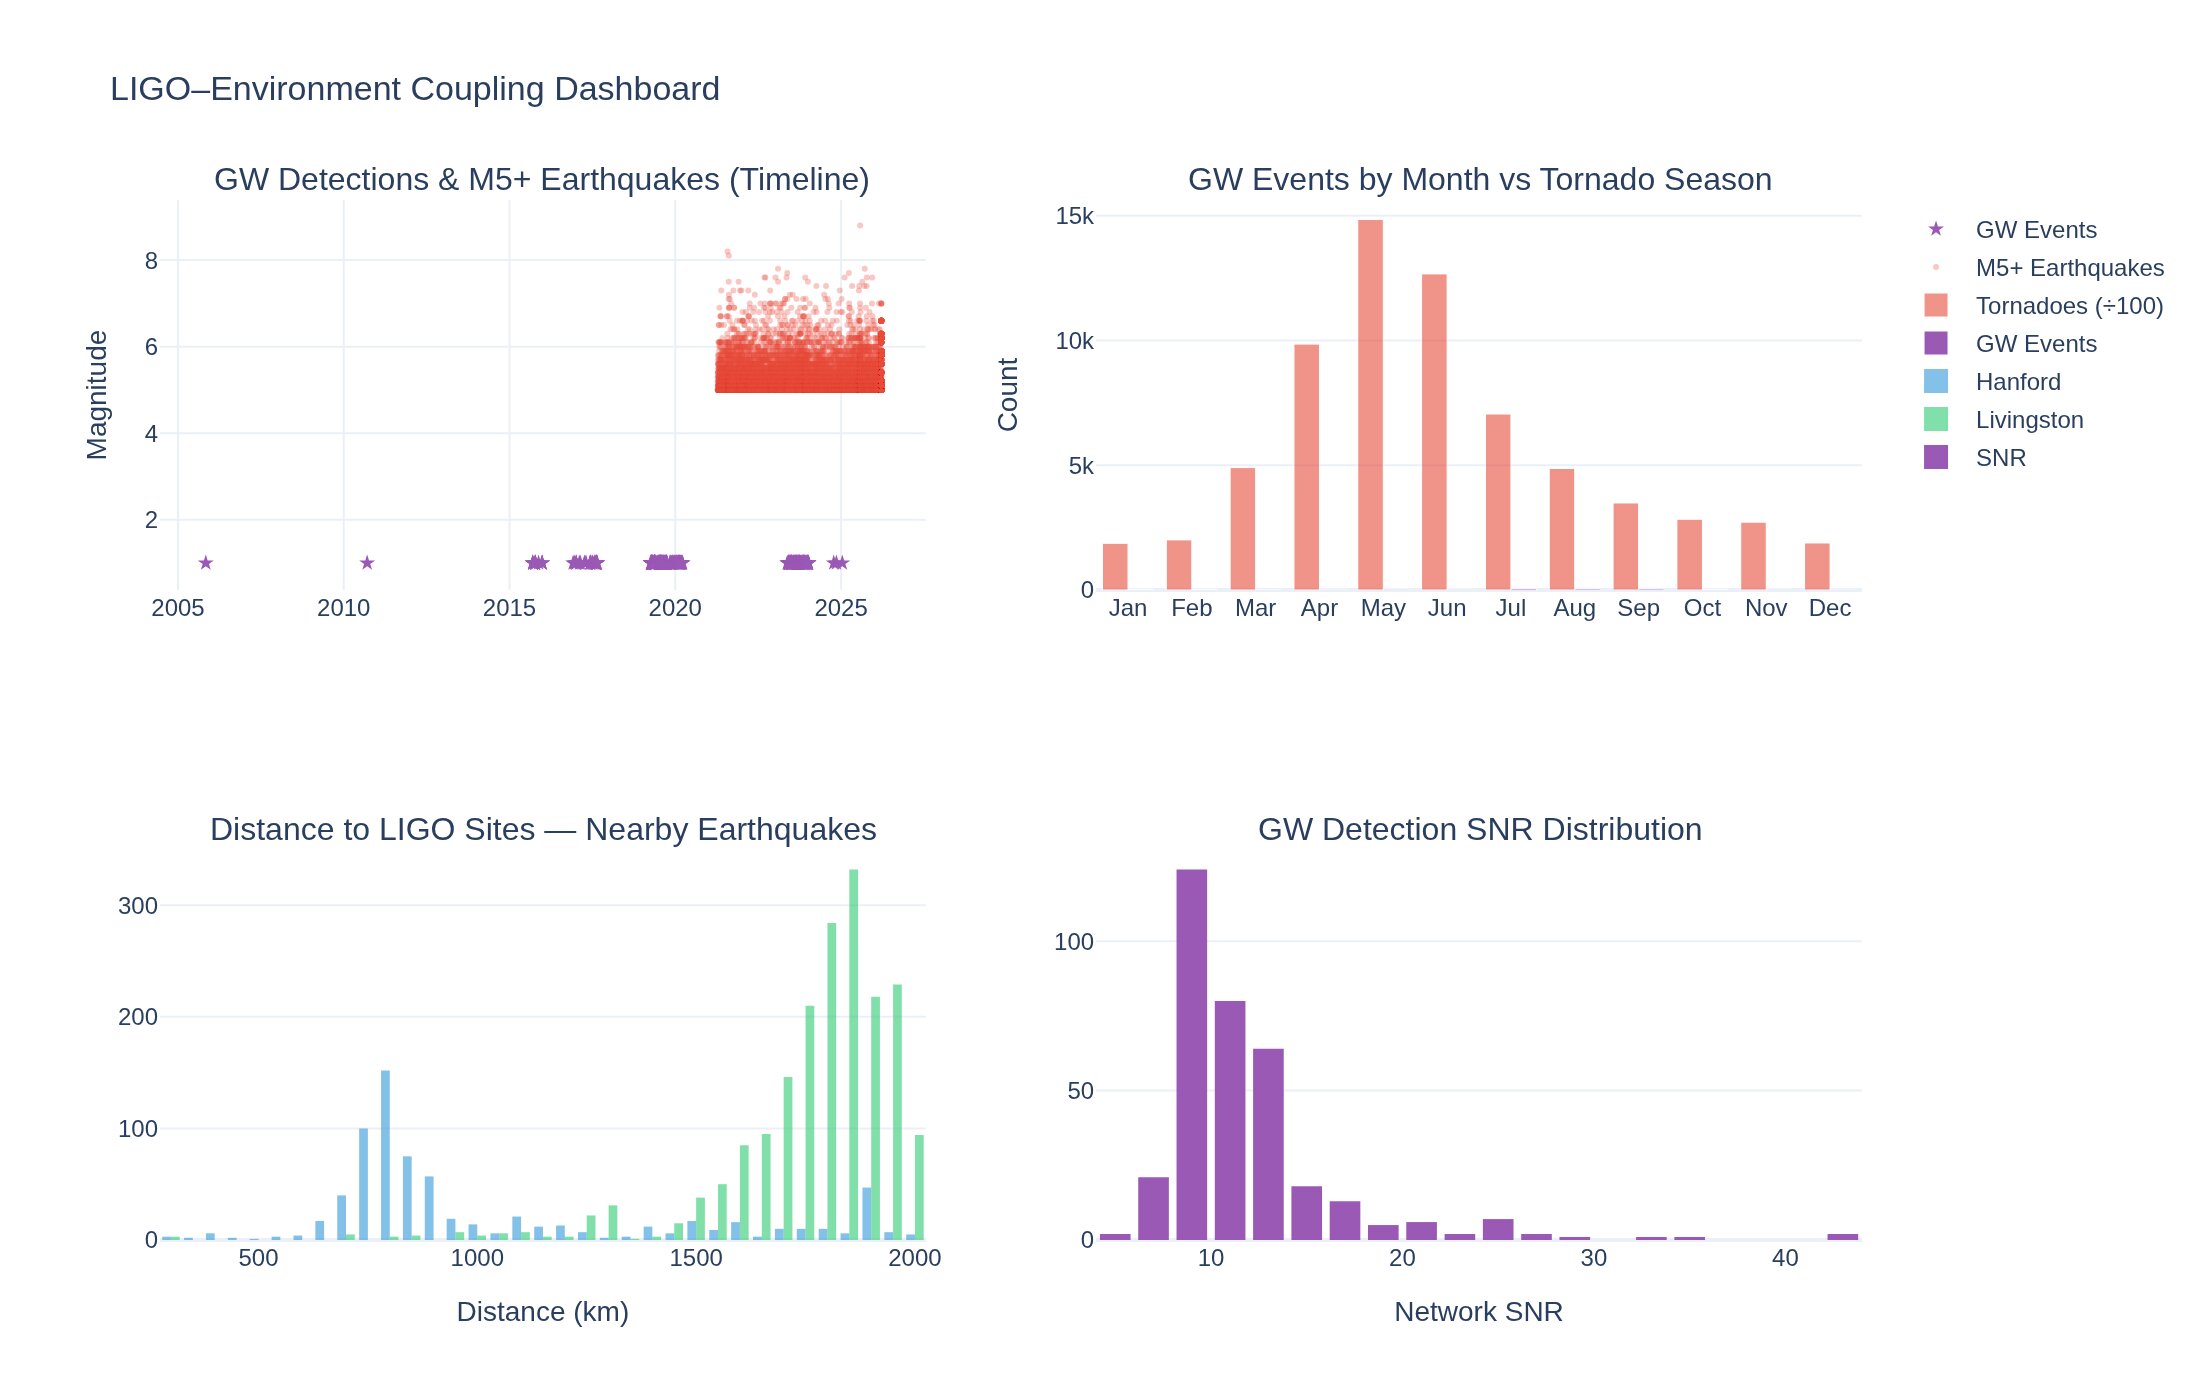
LIGO–Environment Coupling
Do earthquakes, ocean microseisms, and geomagnetic storms correlate with gravitational wave detector sensitivity?
Space weatherdraftMar 2026
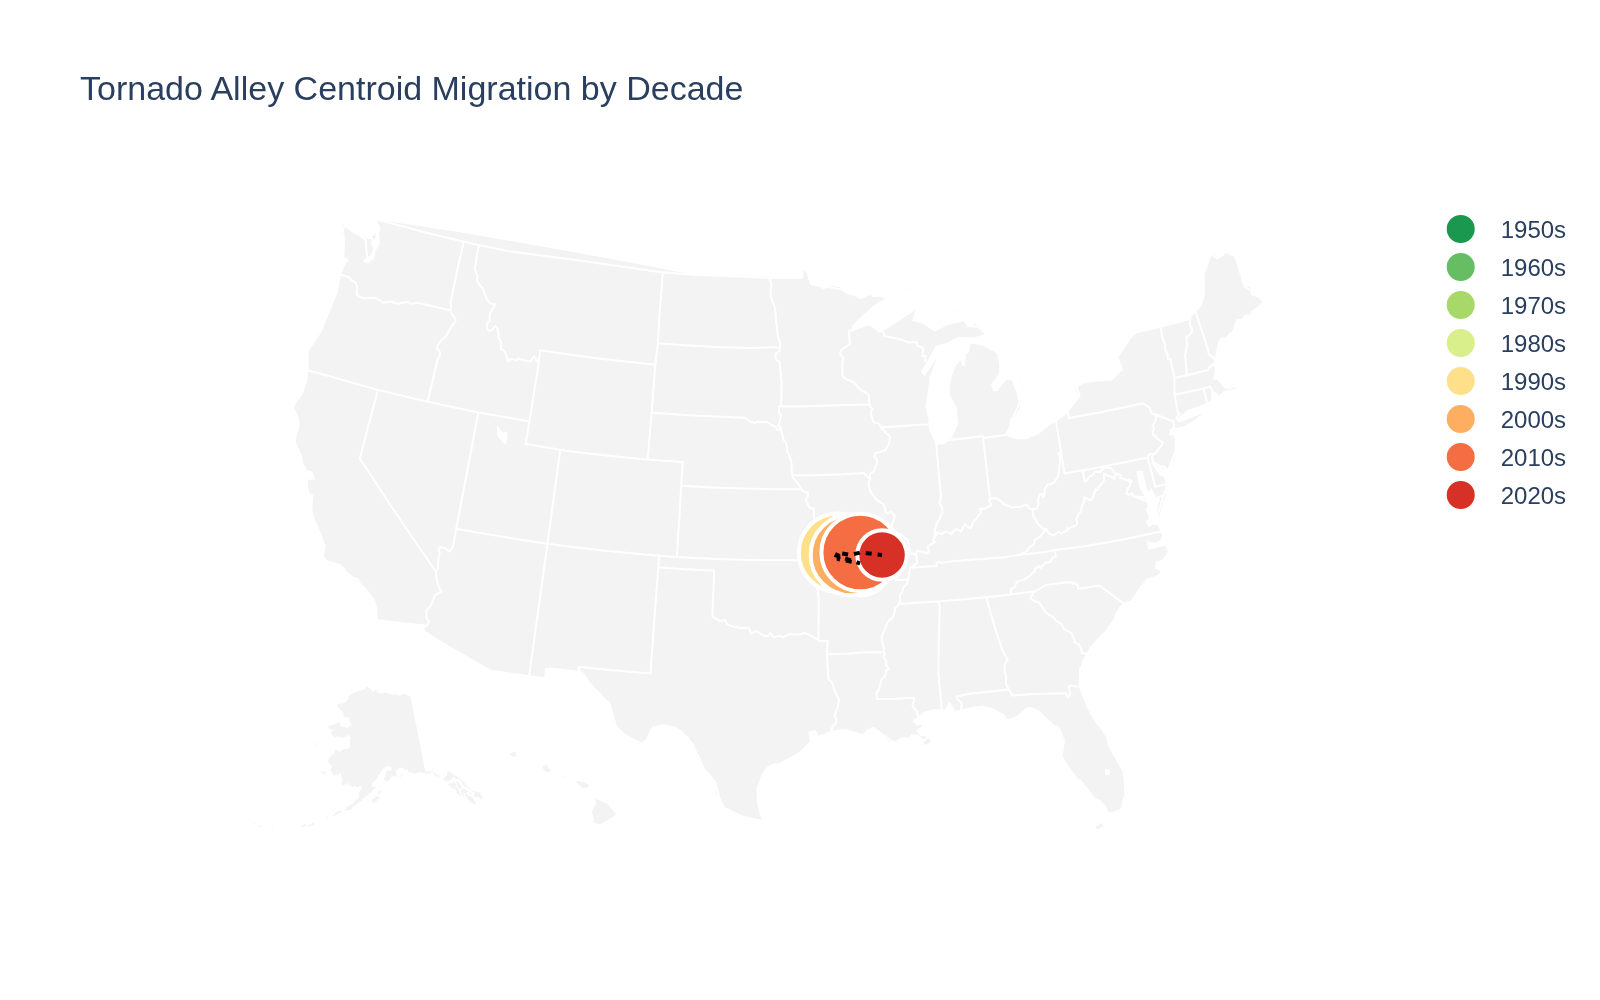
US Tornado Climatology 1950-2023
73-year analysis of tornado patterns, Tornado Alley migration, EF trends, and solar-tornado coupling
ClimatedraftMar 2026
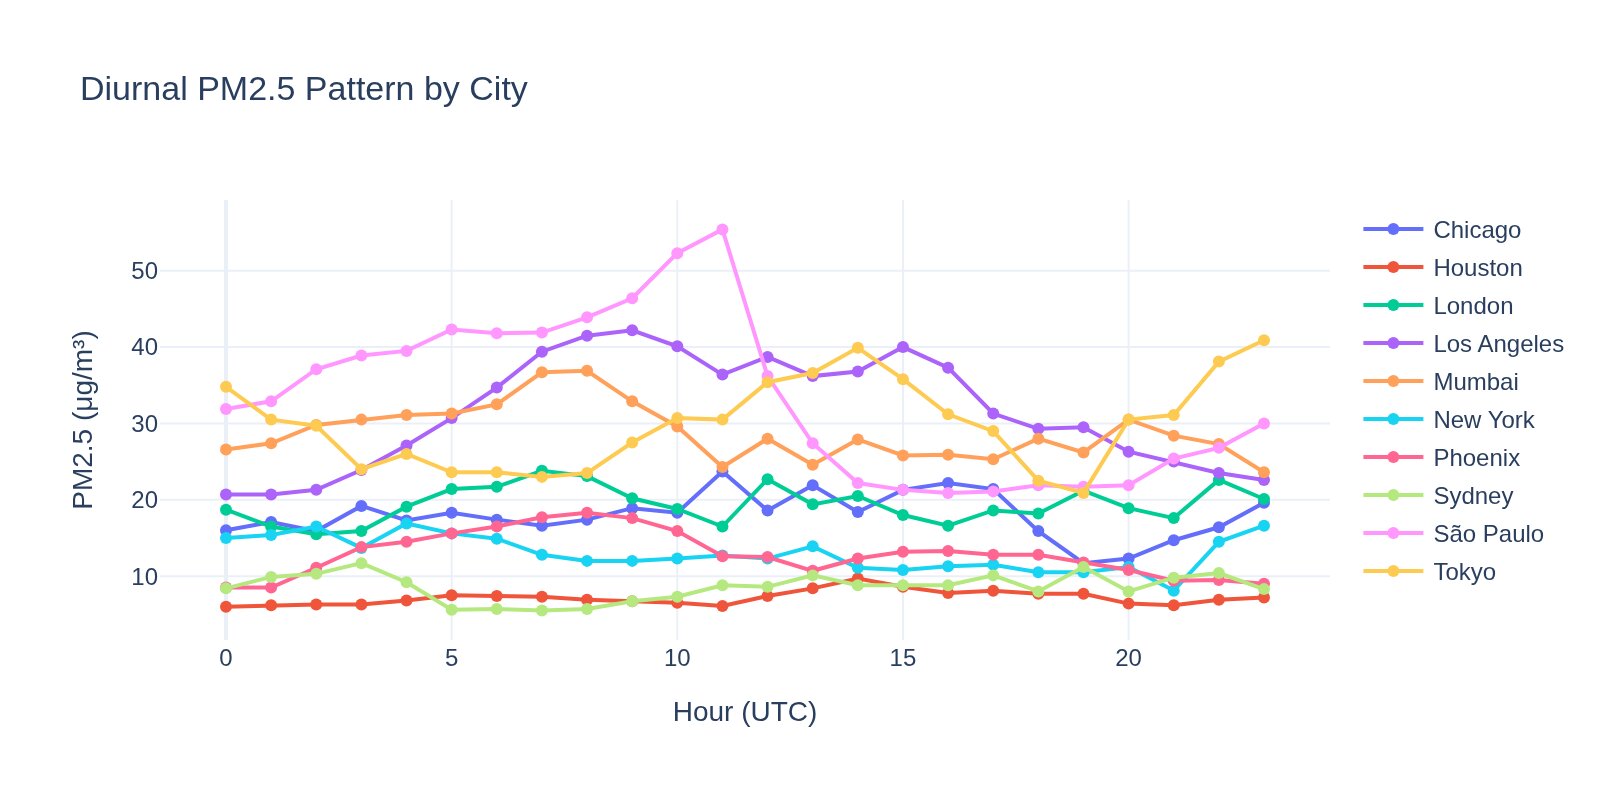
Air Quality–Weather Coupling
Test whether temperature patterns predict PM2.5 spikes via inversion-like conditions
HydrologydraftMar 2026
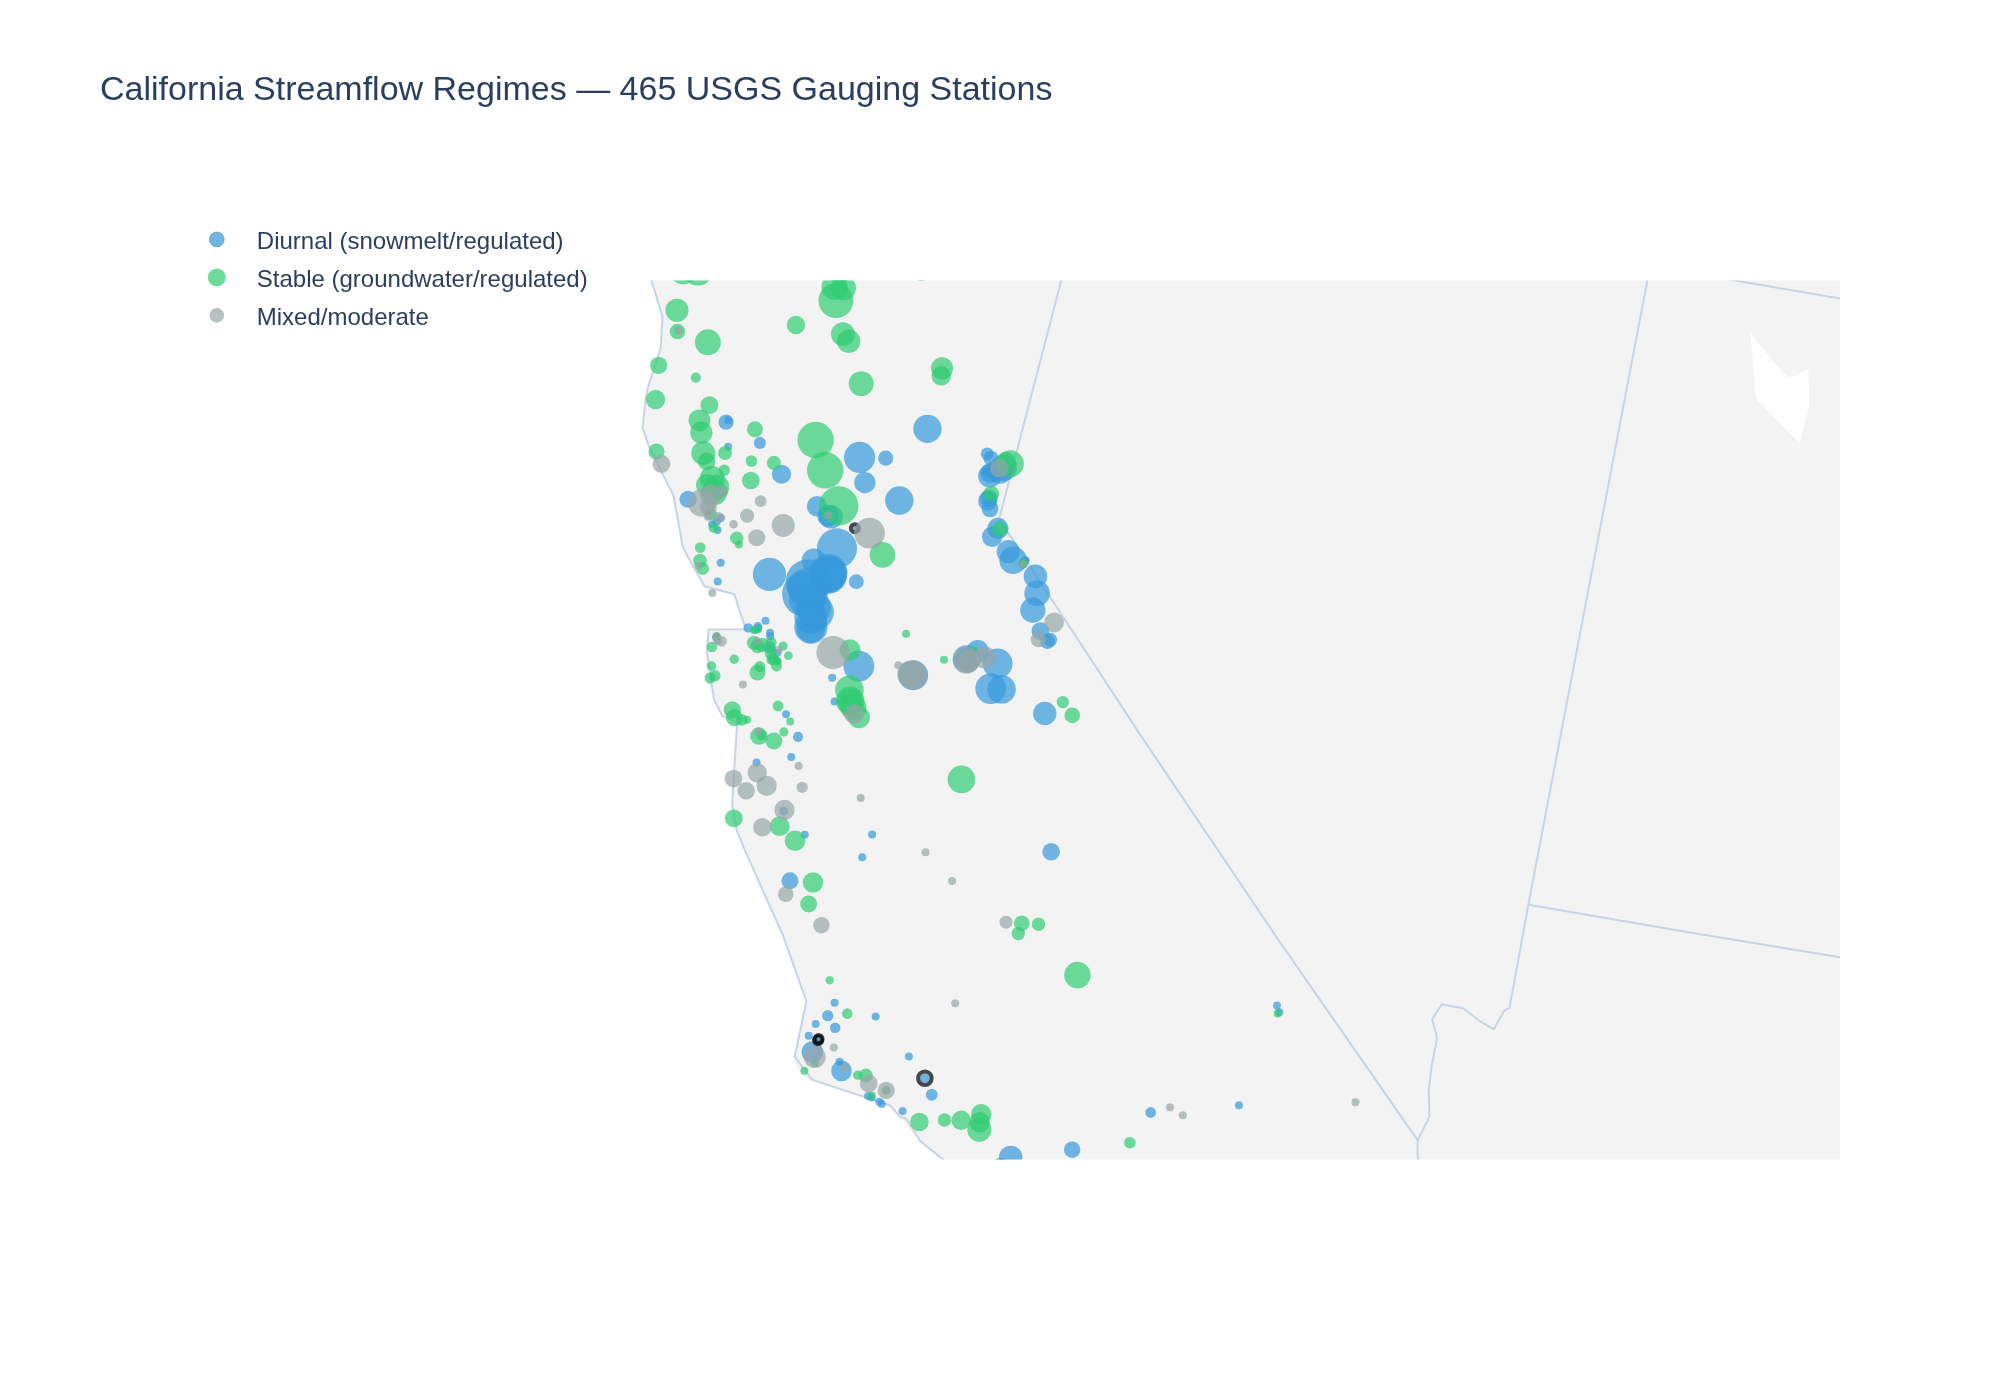
California Streamflow Anomaly Detection
Detect anomalous streamflow patterns across 472 USGS California gauging stations
ClimatedraftMar 2026
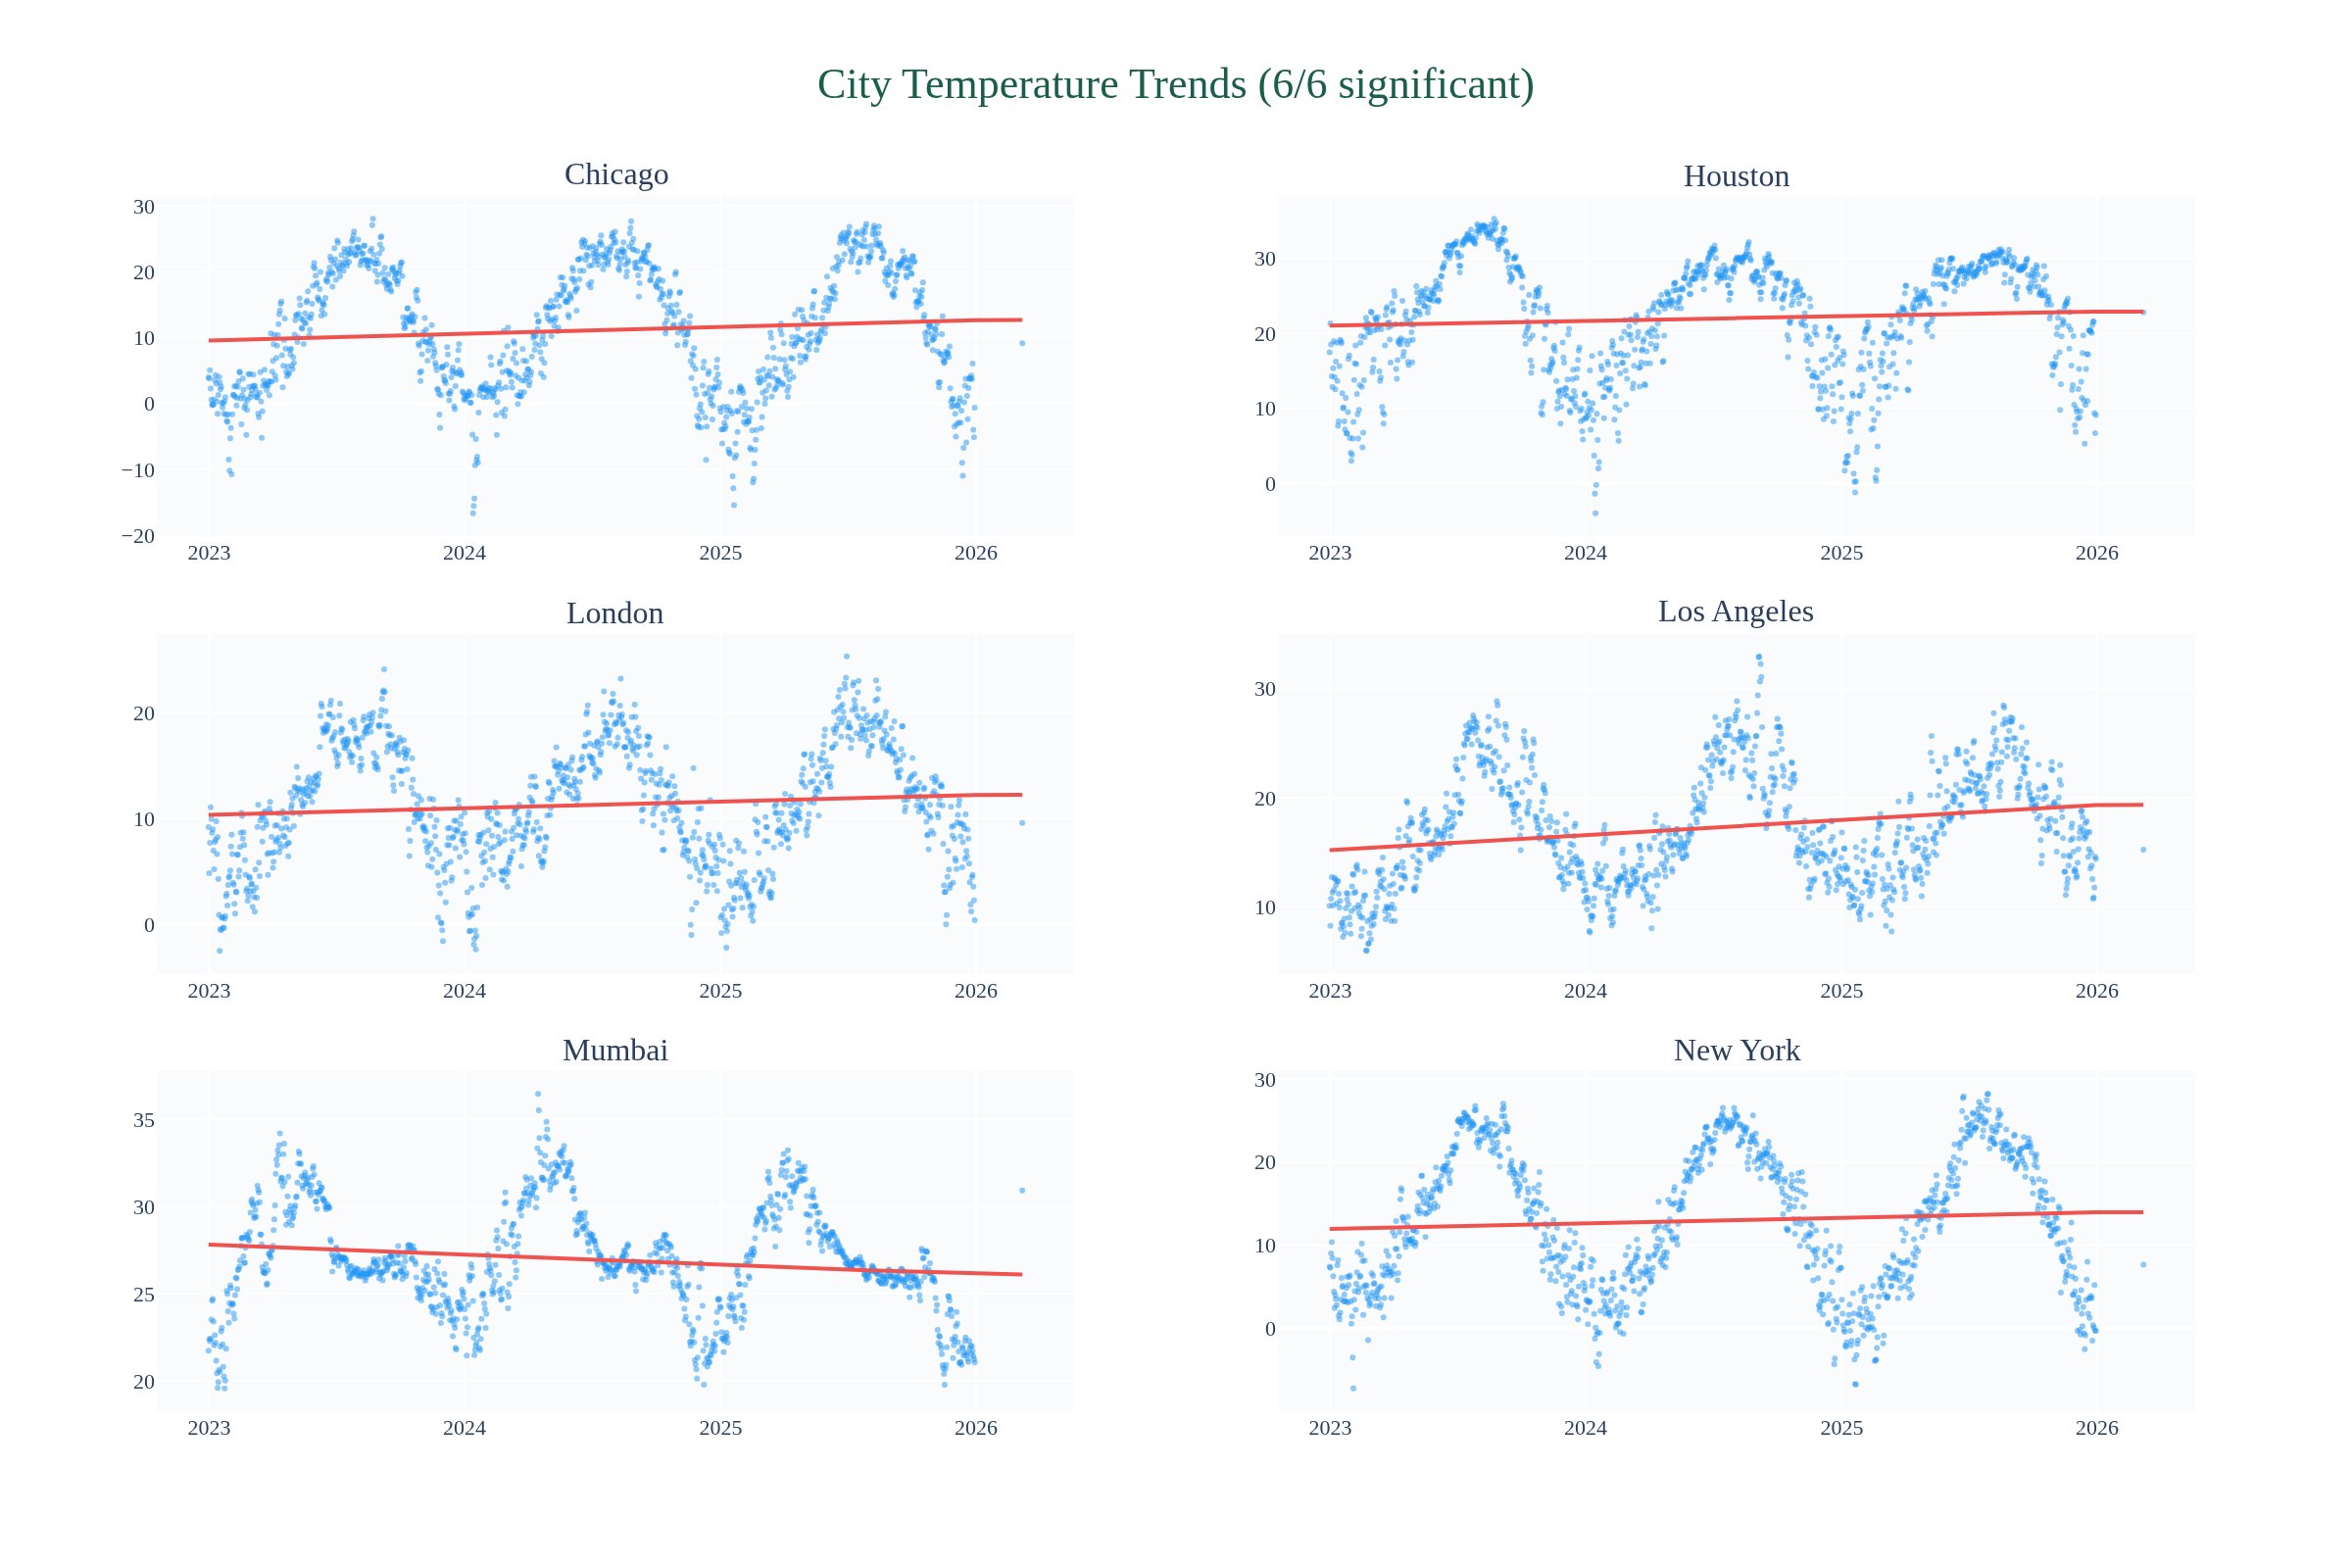
Urban Temperature Trends: Are Cities Warming in Real-Time Data?
Testing whether 3 years of NASA POWER daily temperature data (10 cities) shows detectable warming trends. Using linear regression, seasonal decomposition, and anomaly scoring.
Space weatherdraftMar 2026
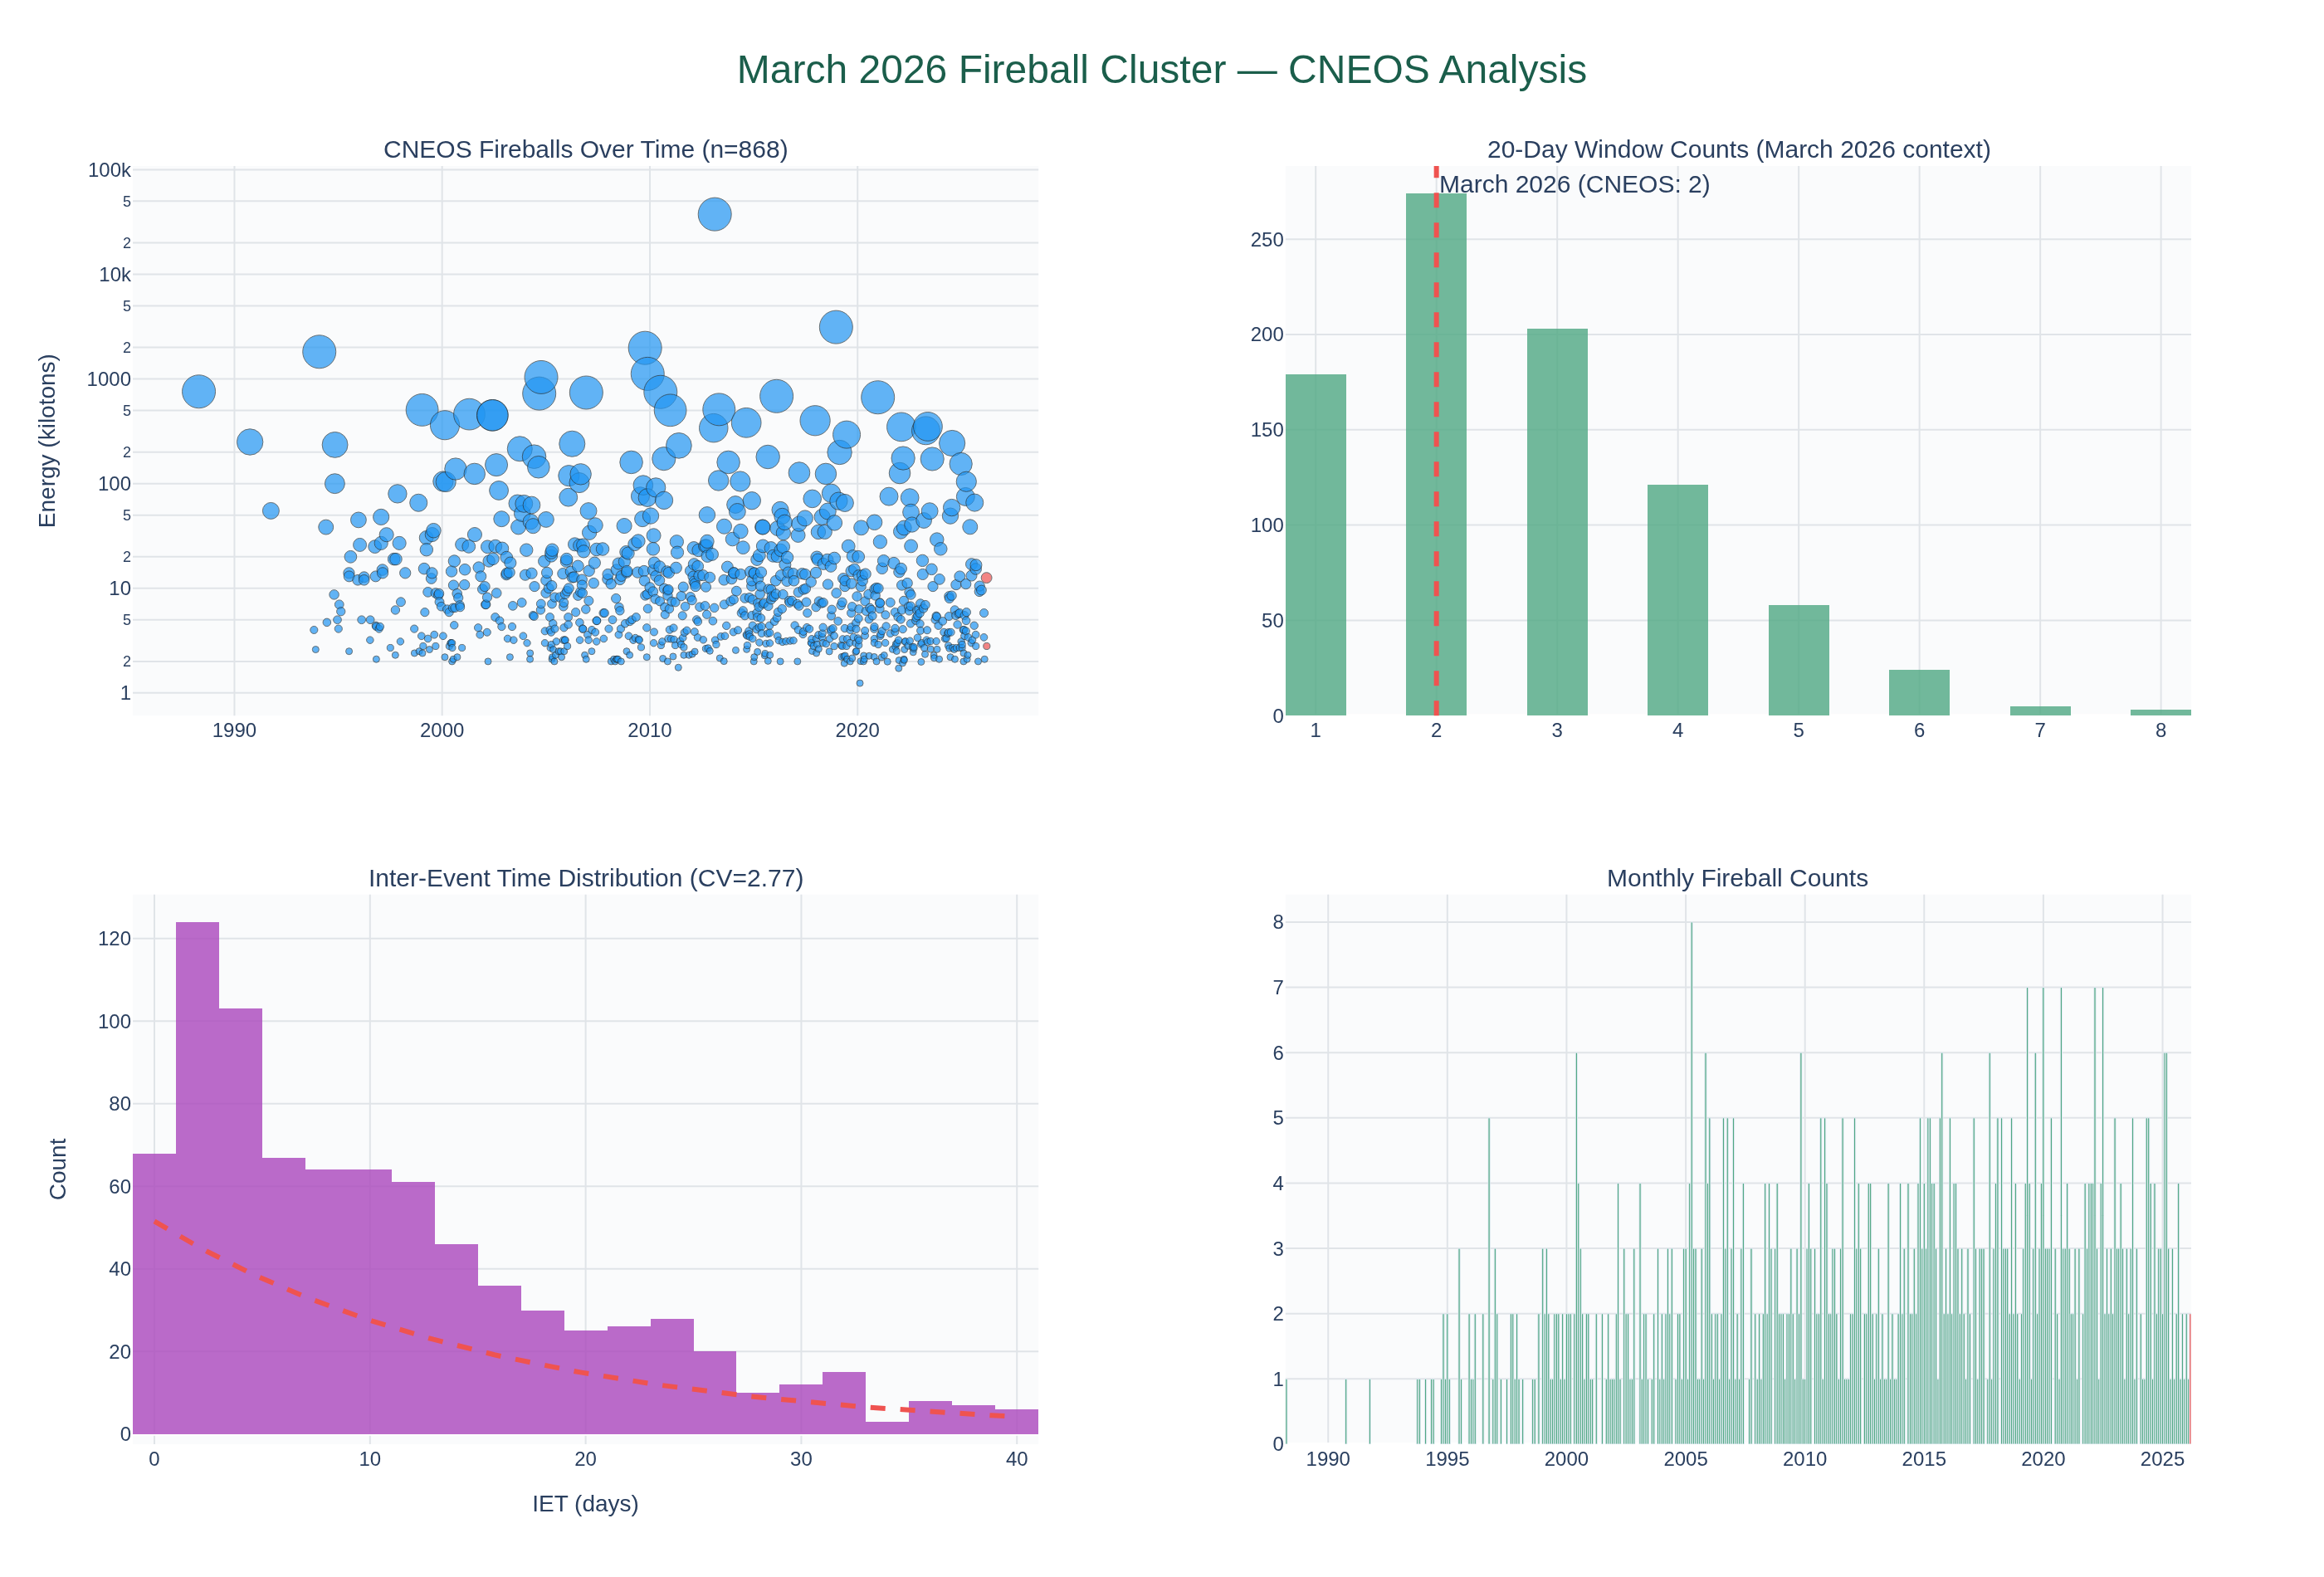
March 2026 Fireball Cluster: Statistical Significance and Space Weather Context
Testing whether the March 2026 fireball cluster (11 events in 20 days, 3 meteorite falls) is statistically significant against the CNEOS historical baseline. Cross-correlating with TerraPulse space weather data to test solar activity connection.
RadiationdraftMar 2026
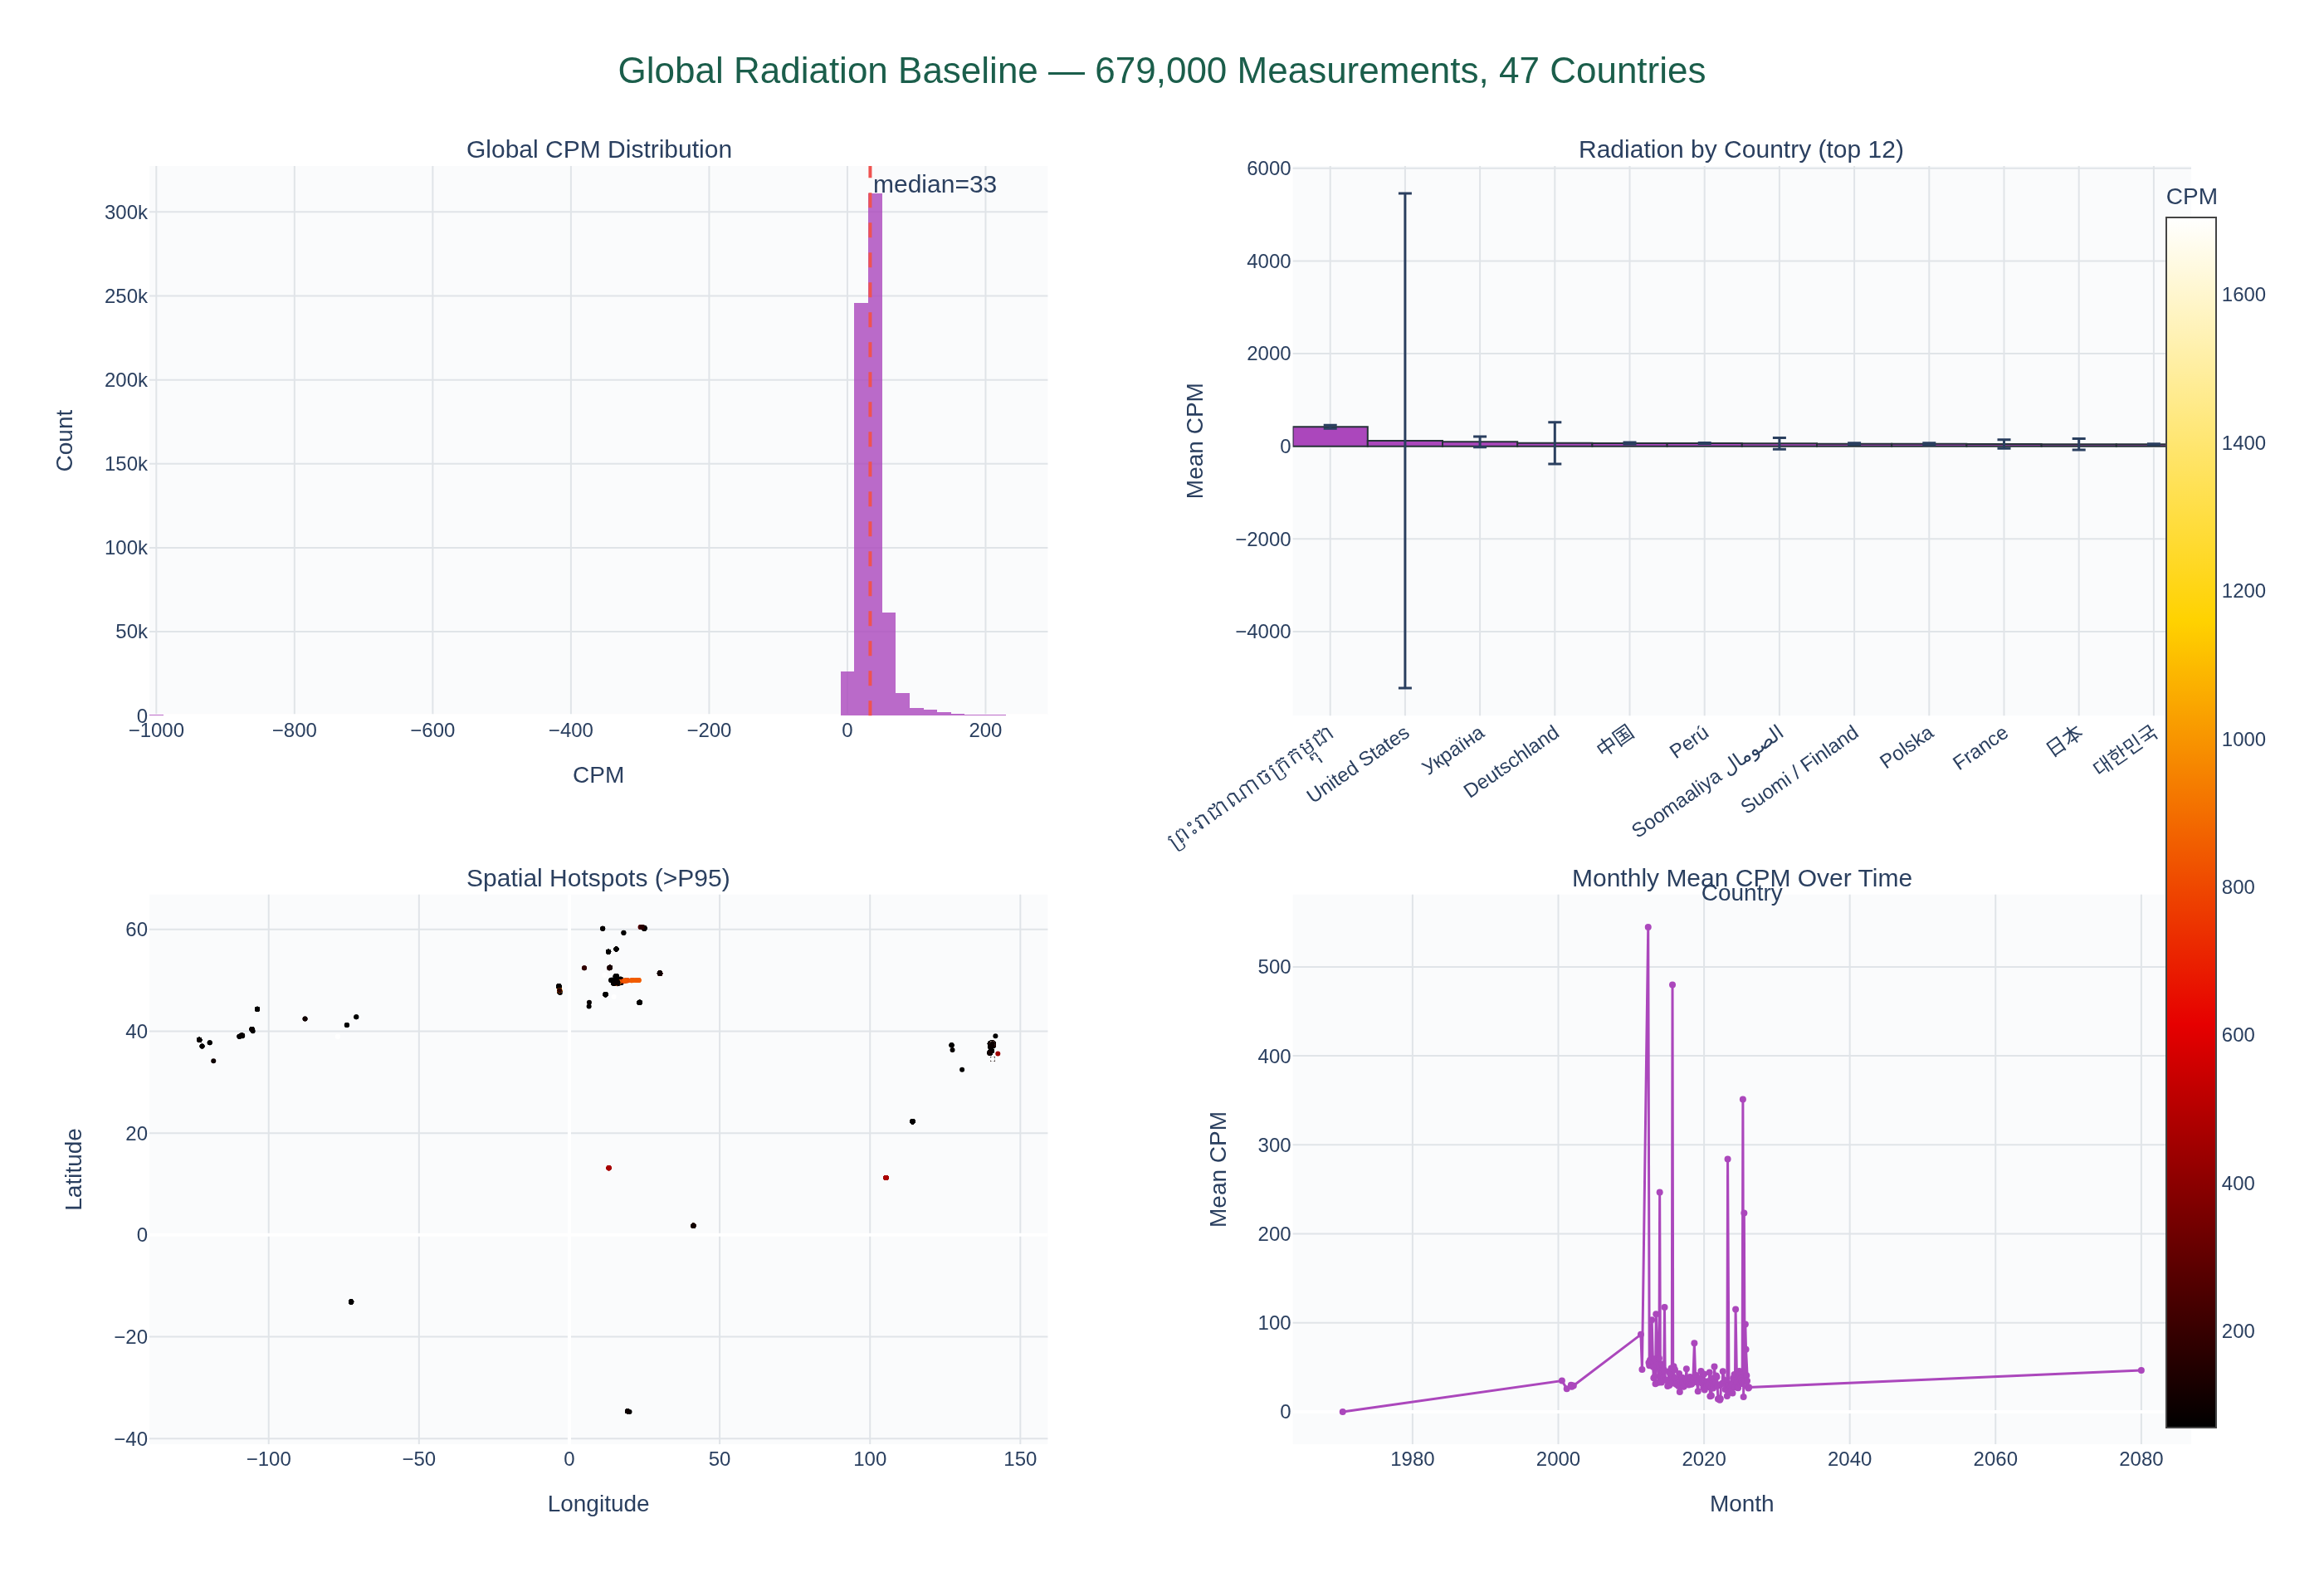
Global Environmental Radiation Baseline from Citizen Science: Signal vs Sampling Bias
Separating physical radiation patterns from observational campaign clustering in 679K Safecast measurements across 45 countries. Can citizen science data establish a reliable global radiation baseline?
SeismologydraftMar 2026
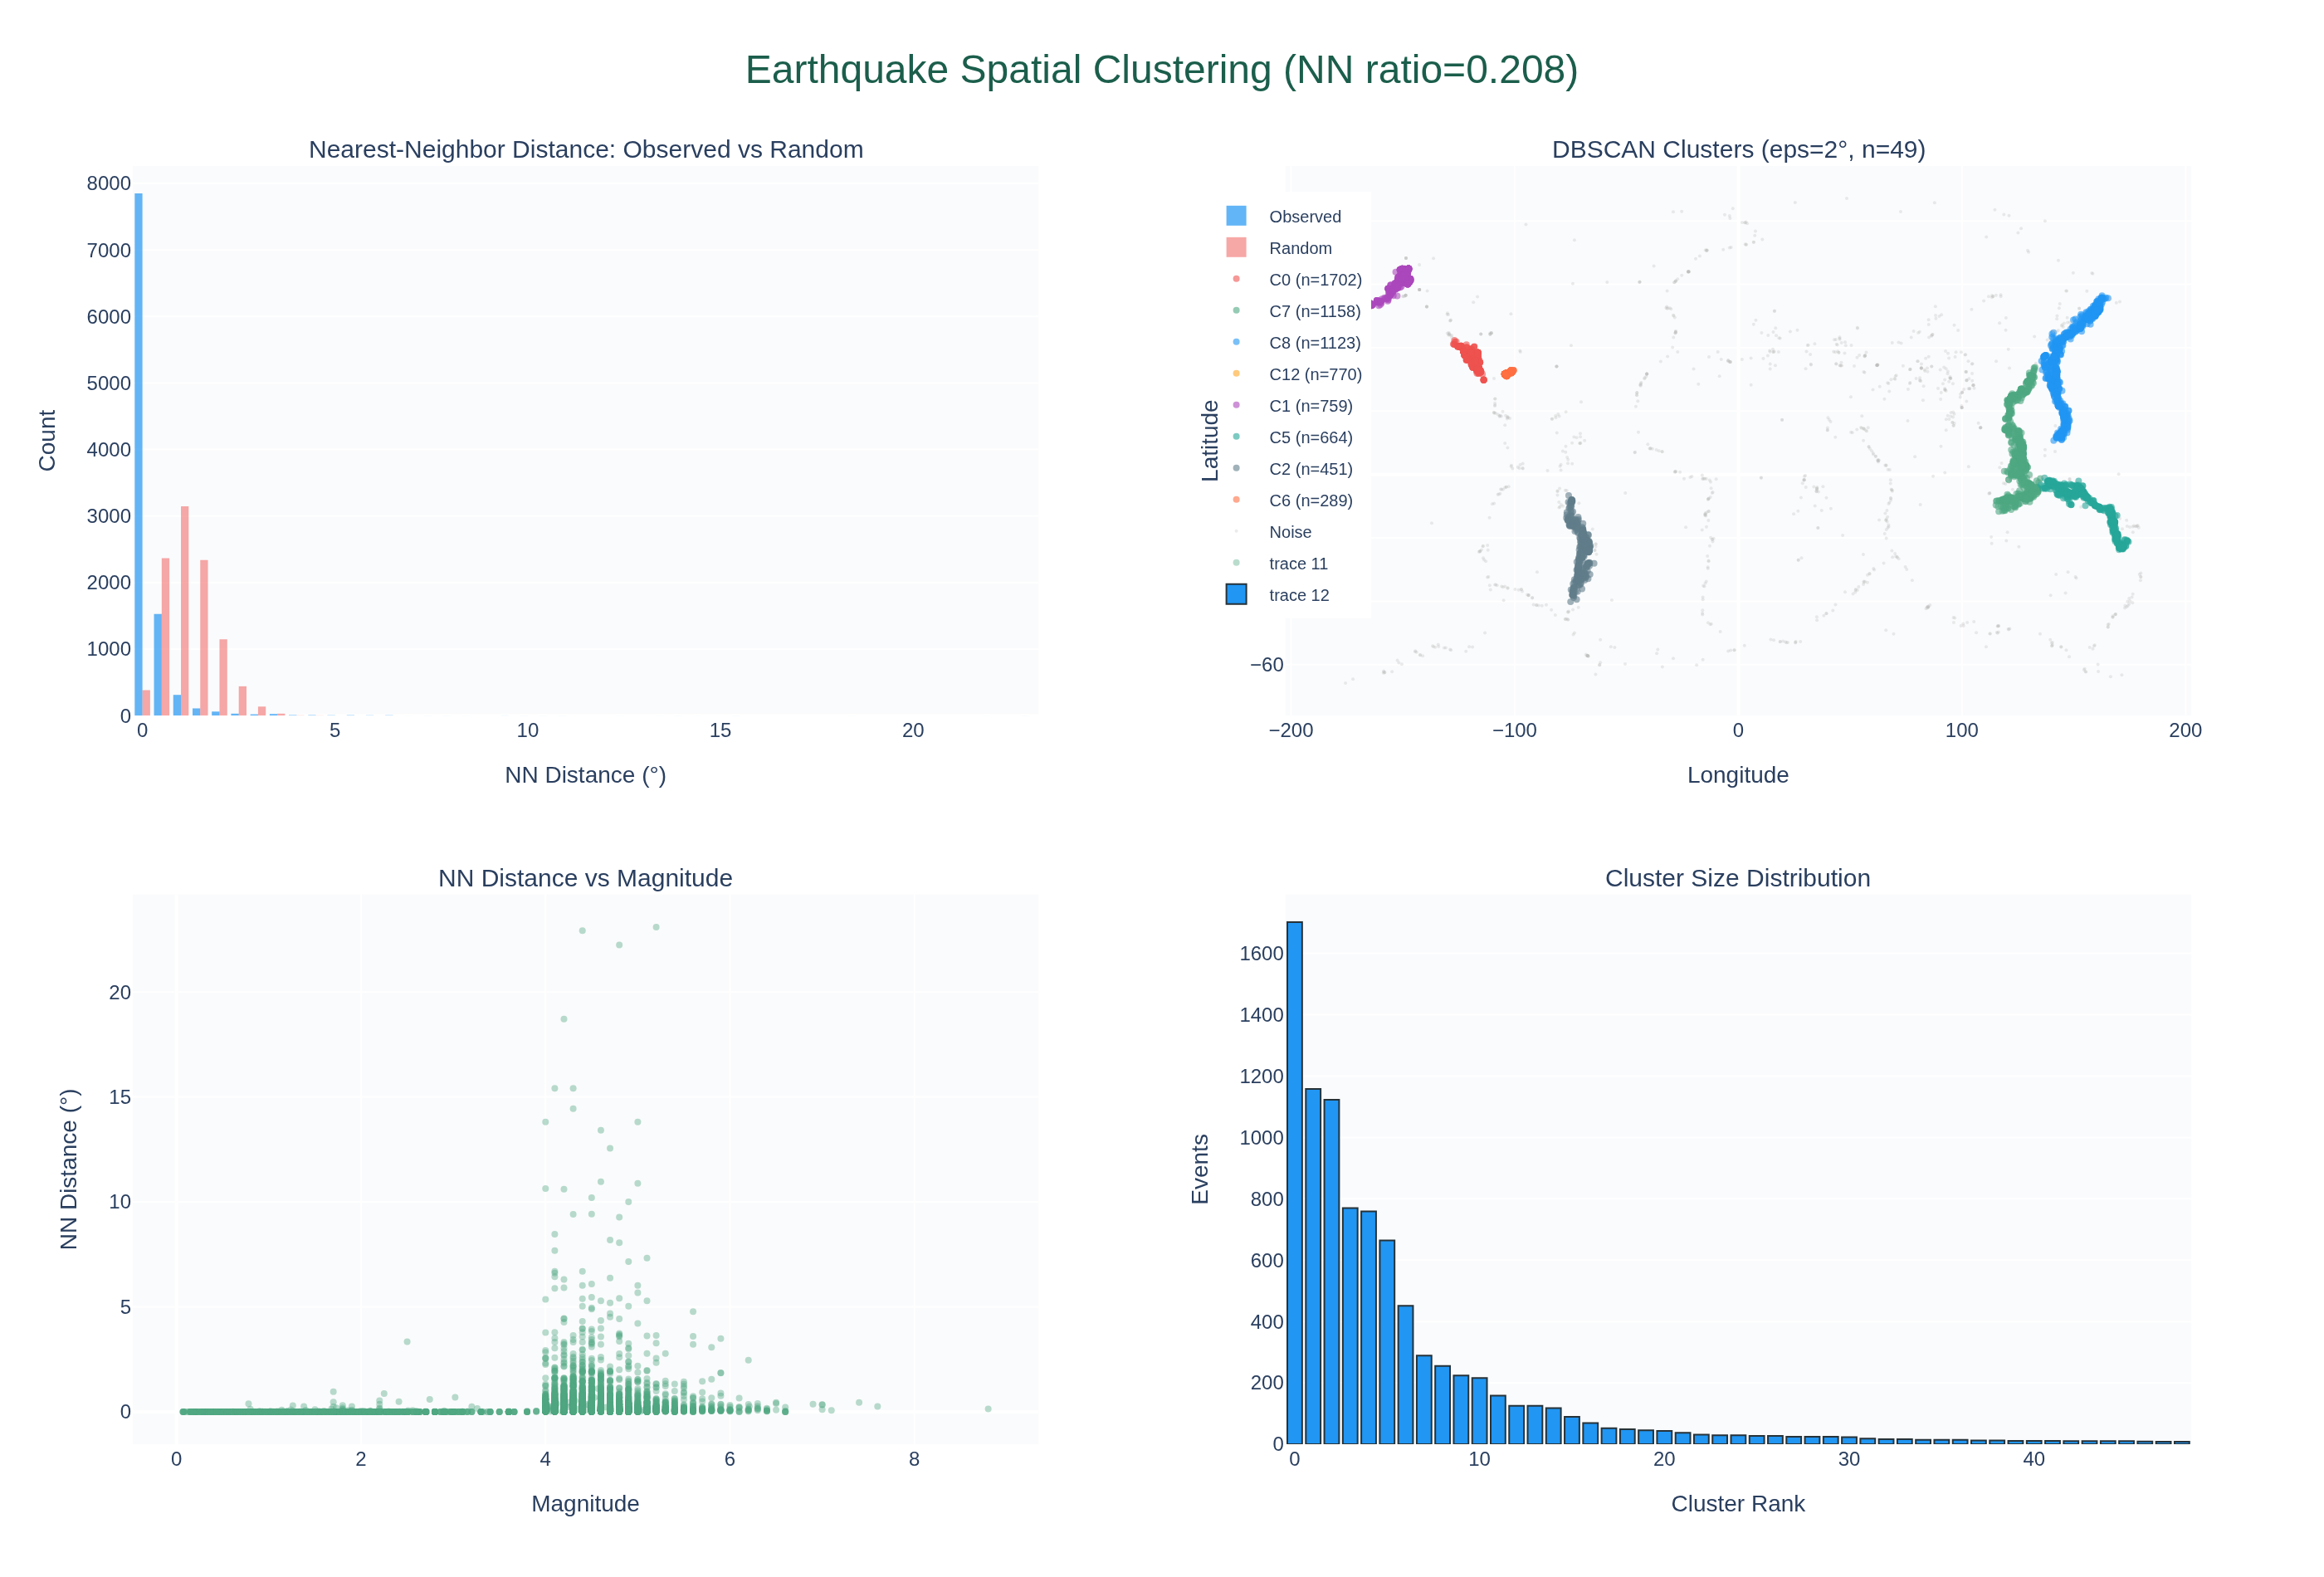
Temporal Clustering of Global M4+ Earthquakes: Spatial clustering
Derivative study expanding on: Spatial clustering. nearest-neighbor distance analysis Parent study: Temporal Clustering of Global M4+ Earthquakes (earthquake-temporal-clustering)
Cross-domaindraftMar 2026
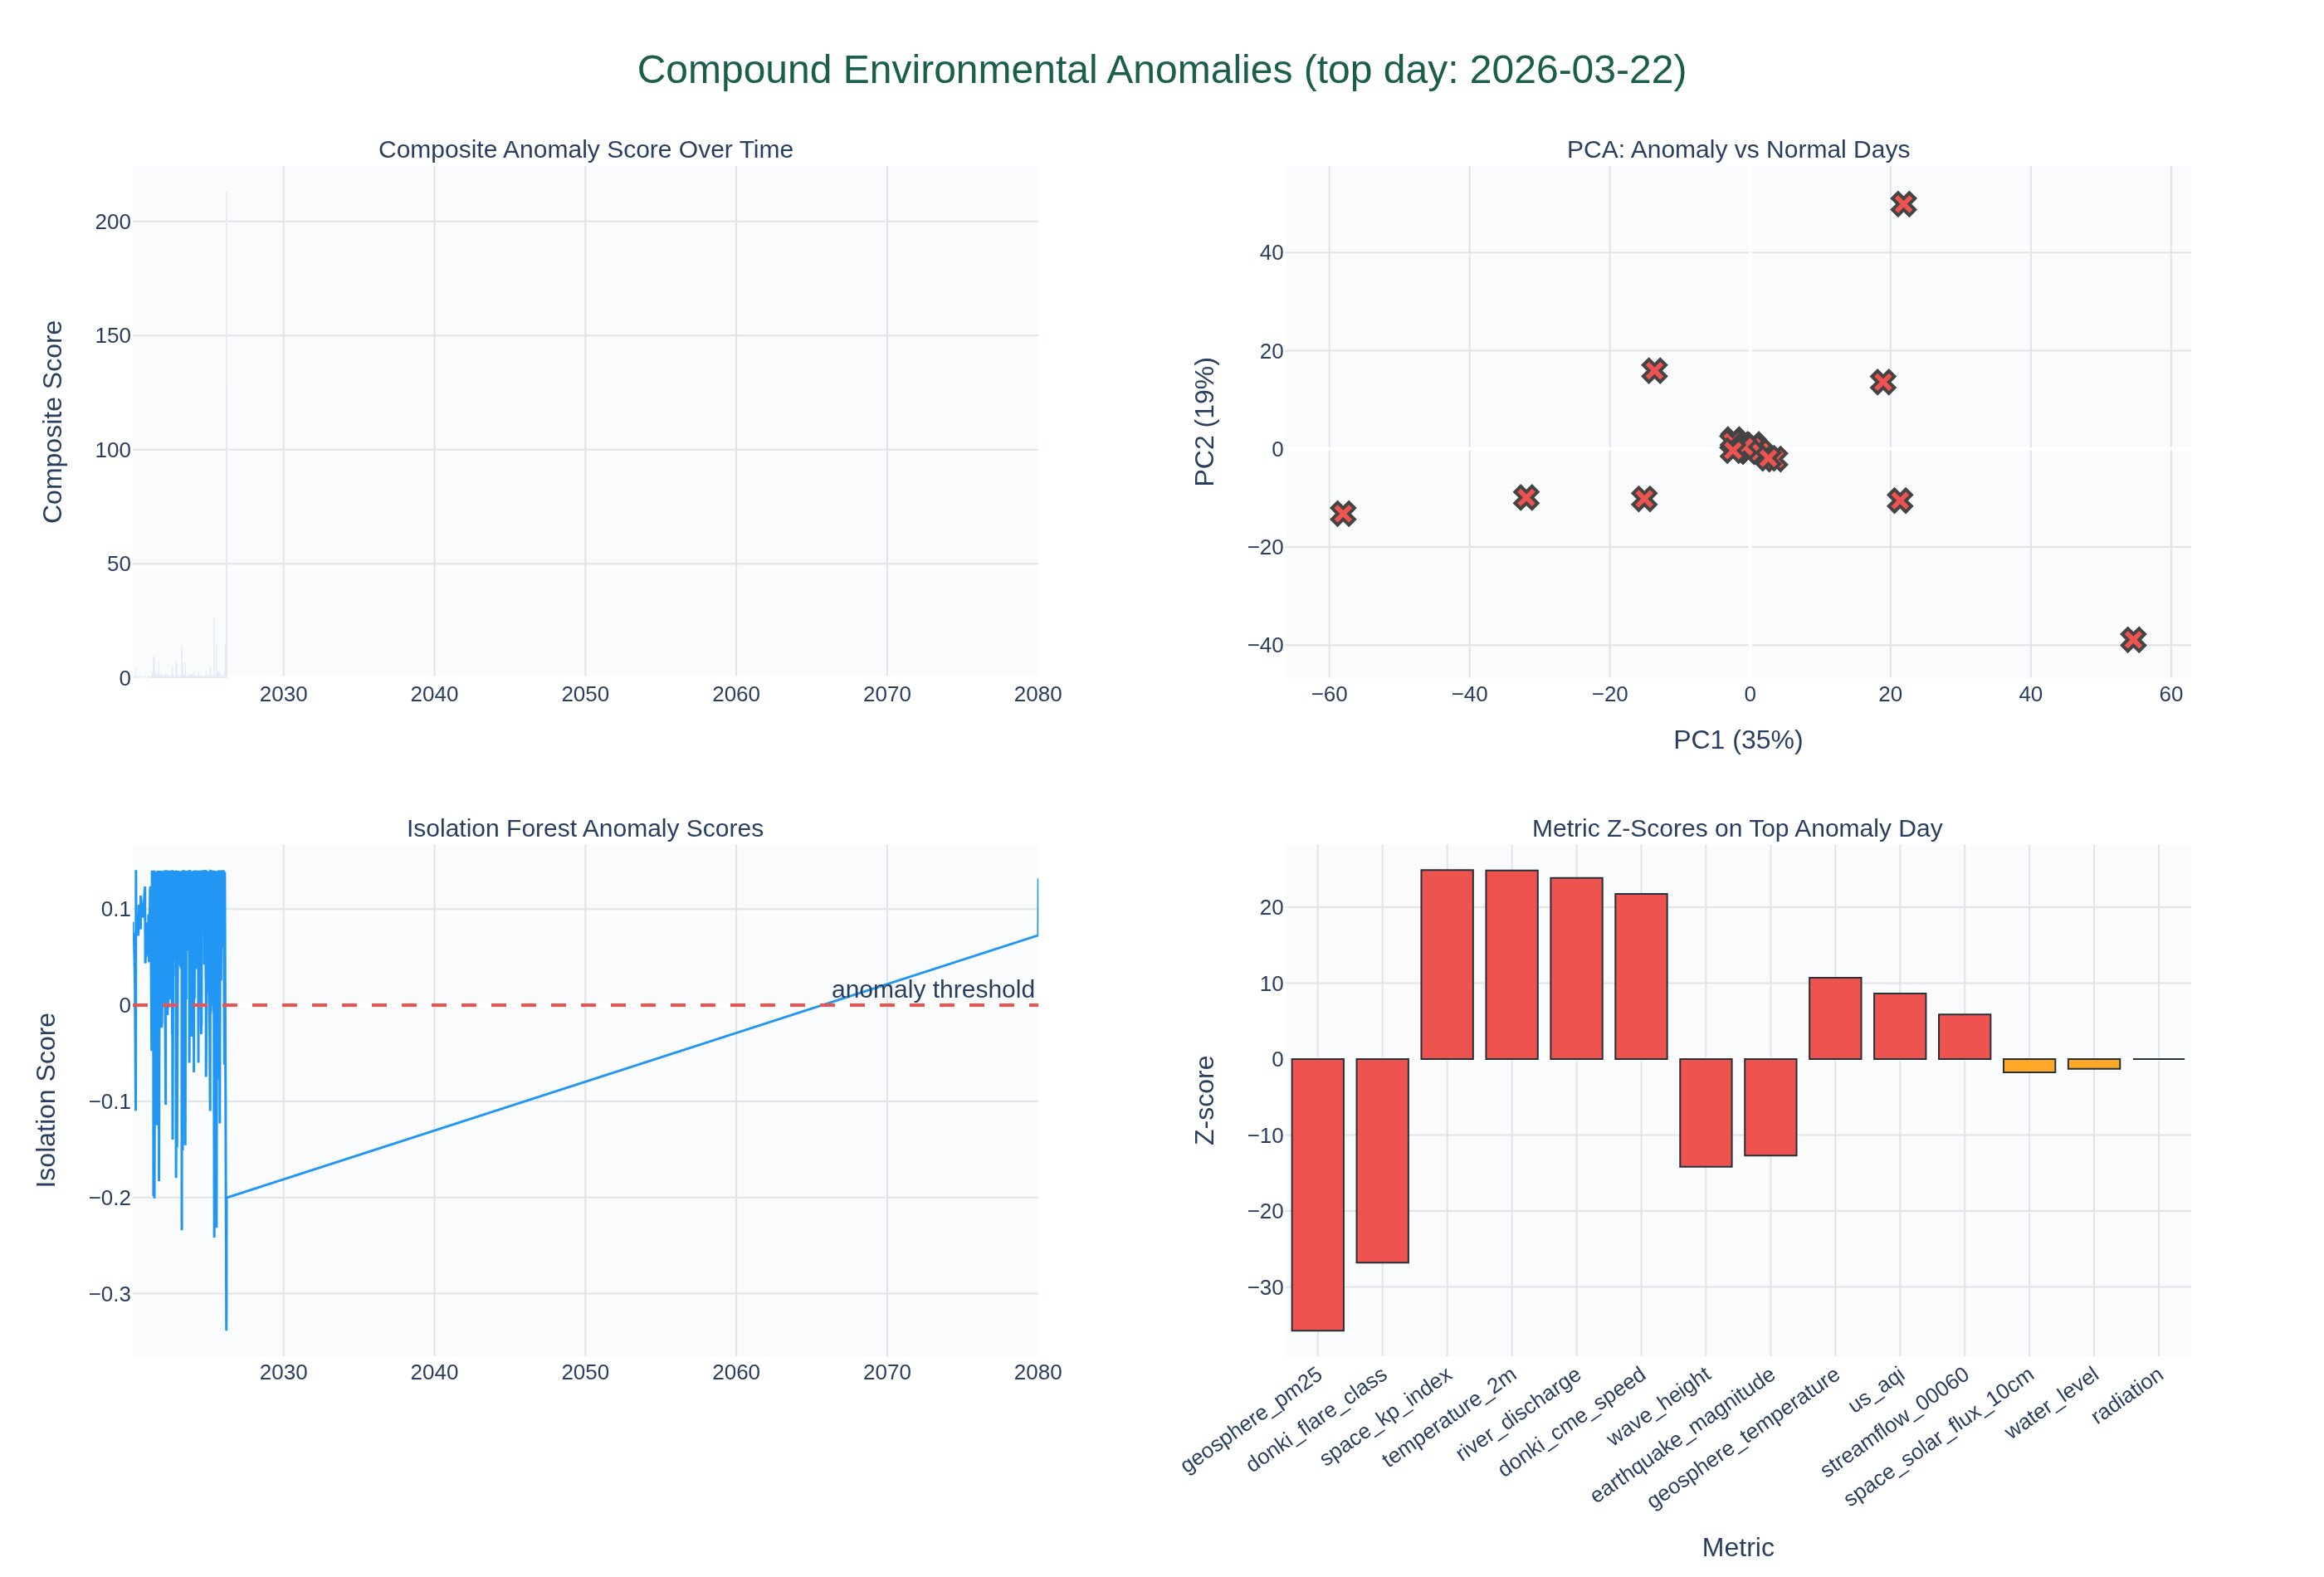
Compound Environmental Anomalies: Multi-Metric Unusual Days
Detecting days where multiple environmental metrics are simultaneously anomalous using Z-score analysis and Isolation Forest. When earthquakes, space weather, and air quality all spike together: is it coincidence or connection?
Space weatherdraftMar 2026
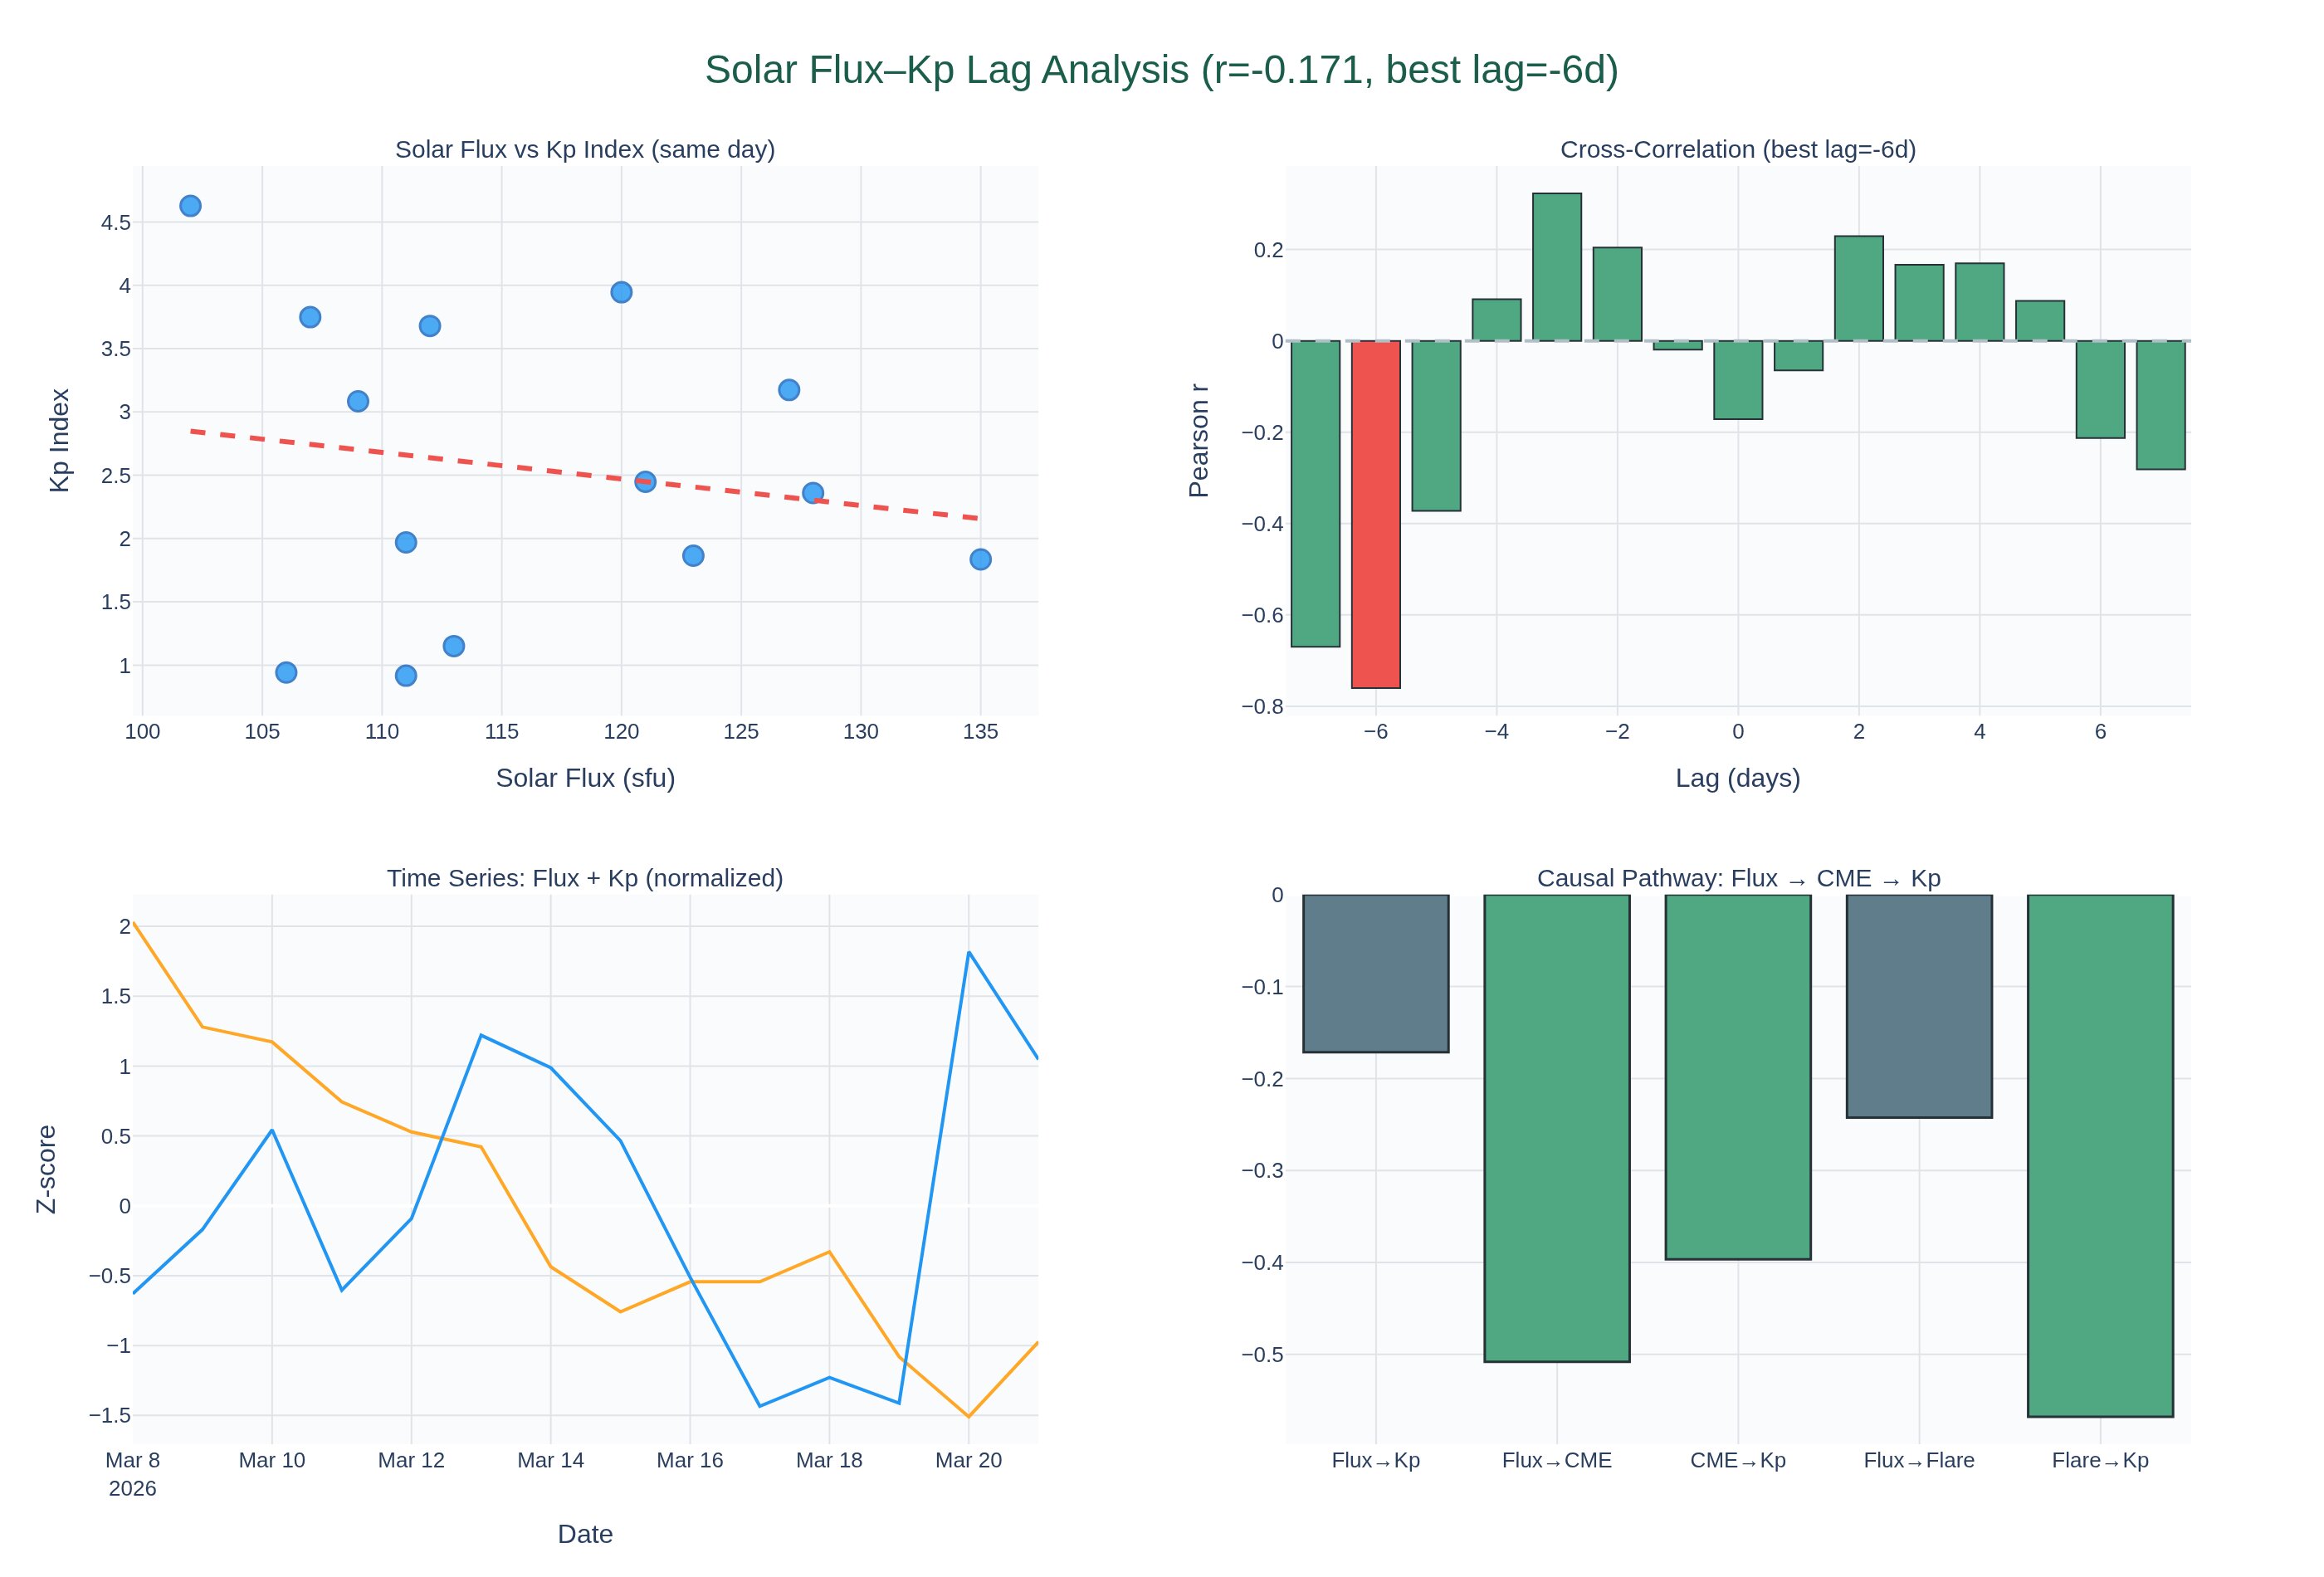
Solar Flux–Kp Index Time Lag: Paper Replication Study
Replicating Georgieva & Kirov (2010) claim that the correlation between solar activity and geomagnetic activity varies with a changing time lag. Testing with NOAA SWPC solar flux and Kp index data.
SeismologydraftMar 2026
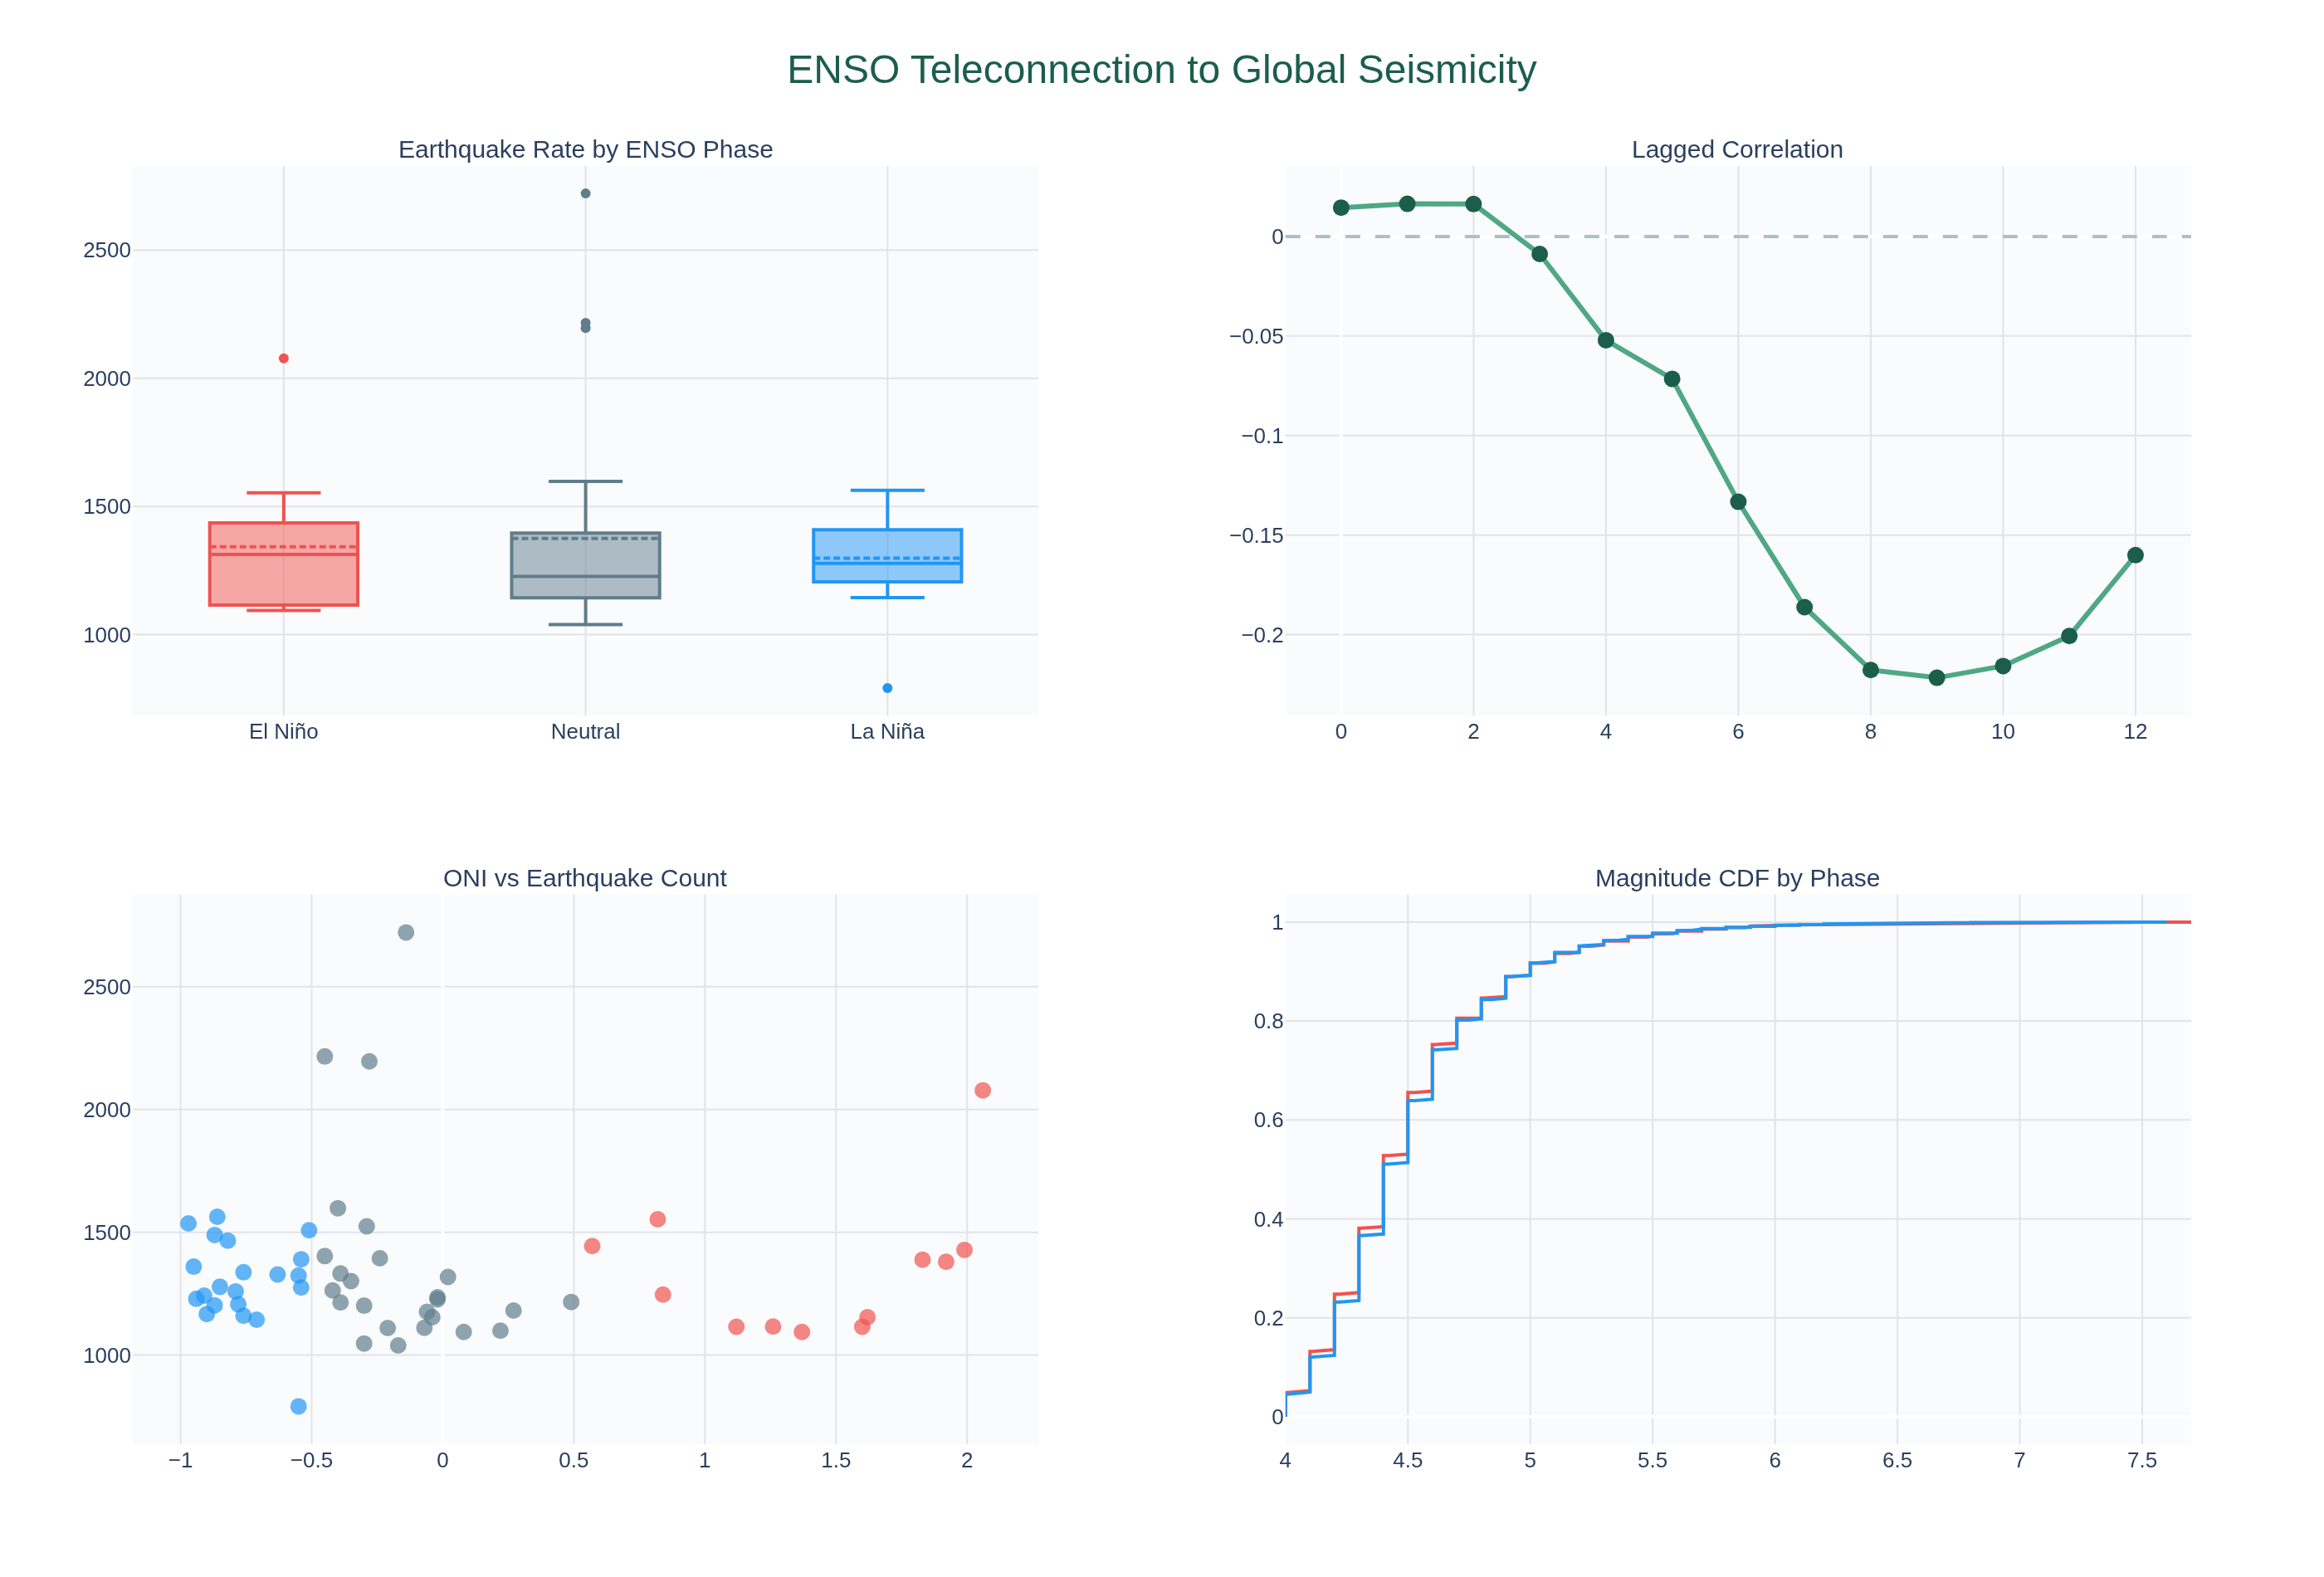
ENSO Teleconnection to Global Seismicity: Replication Study
Replicating and extending published claims that El Niño/La Niña phases modulate global earthquake rates. Testing crustal loading hypothesis via sea level redistribution. Using 76 years of ONI data and 5 years of USGS M4+ earthquake records.
SeismologydraftMar 2026
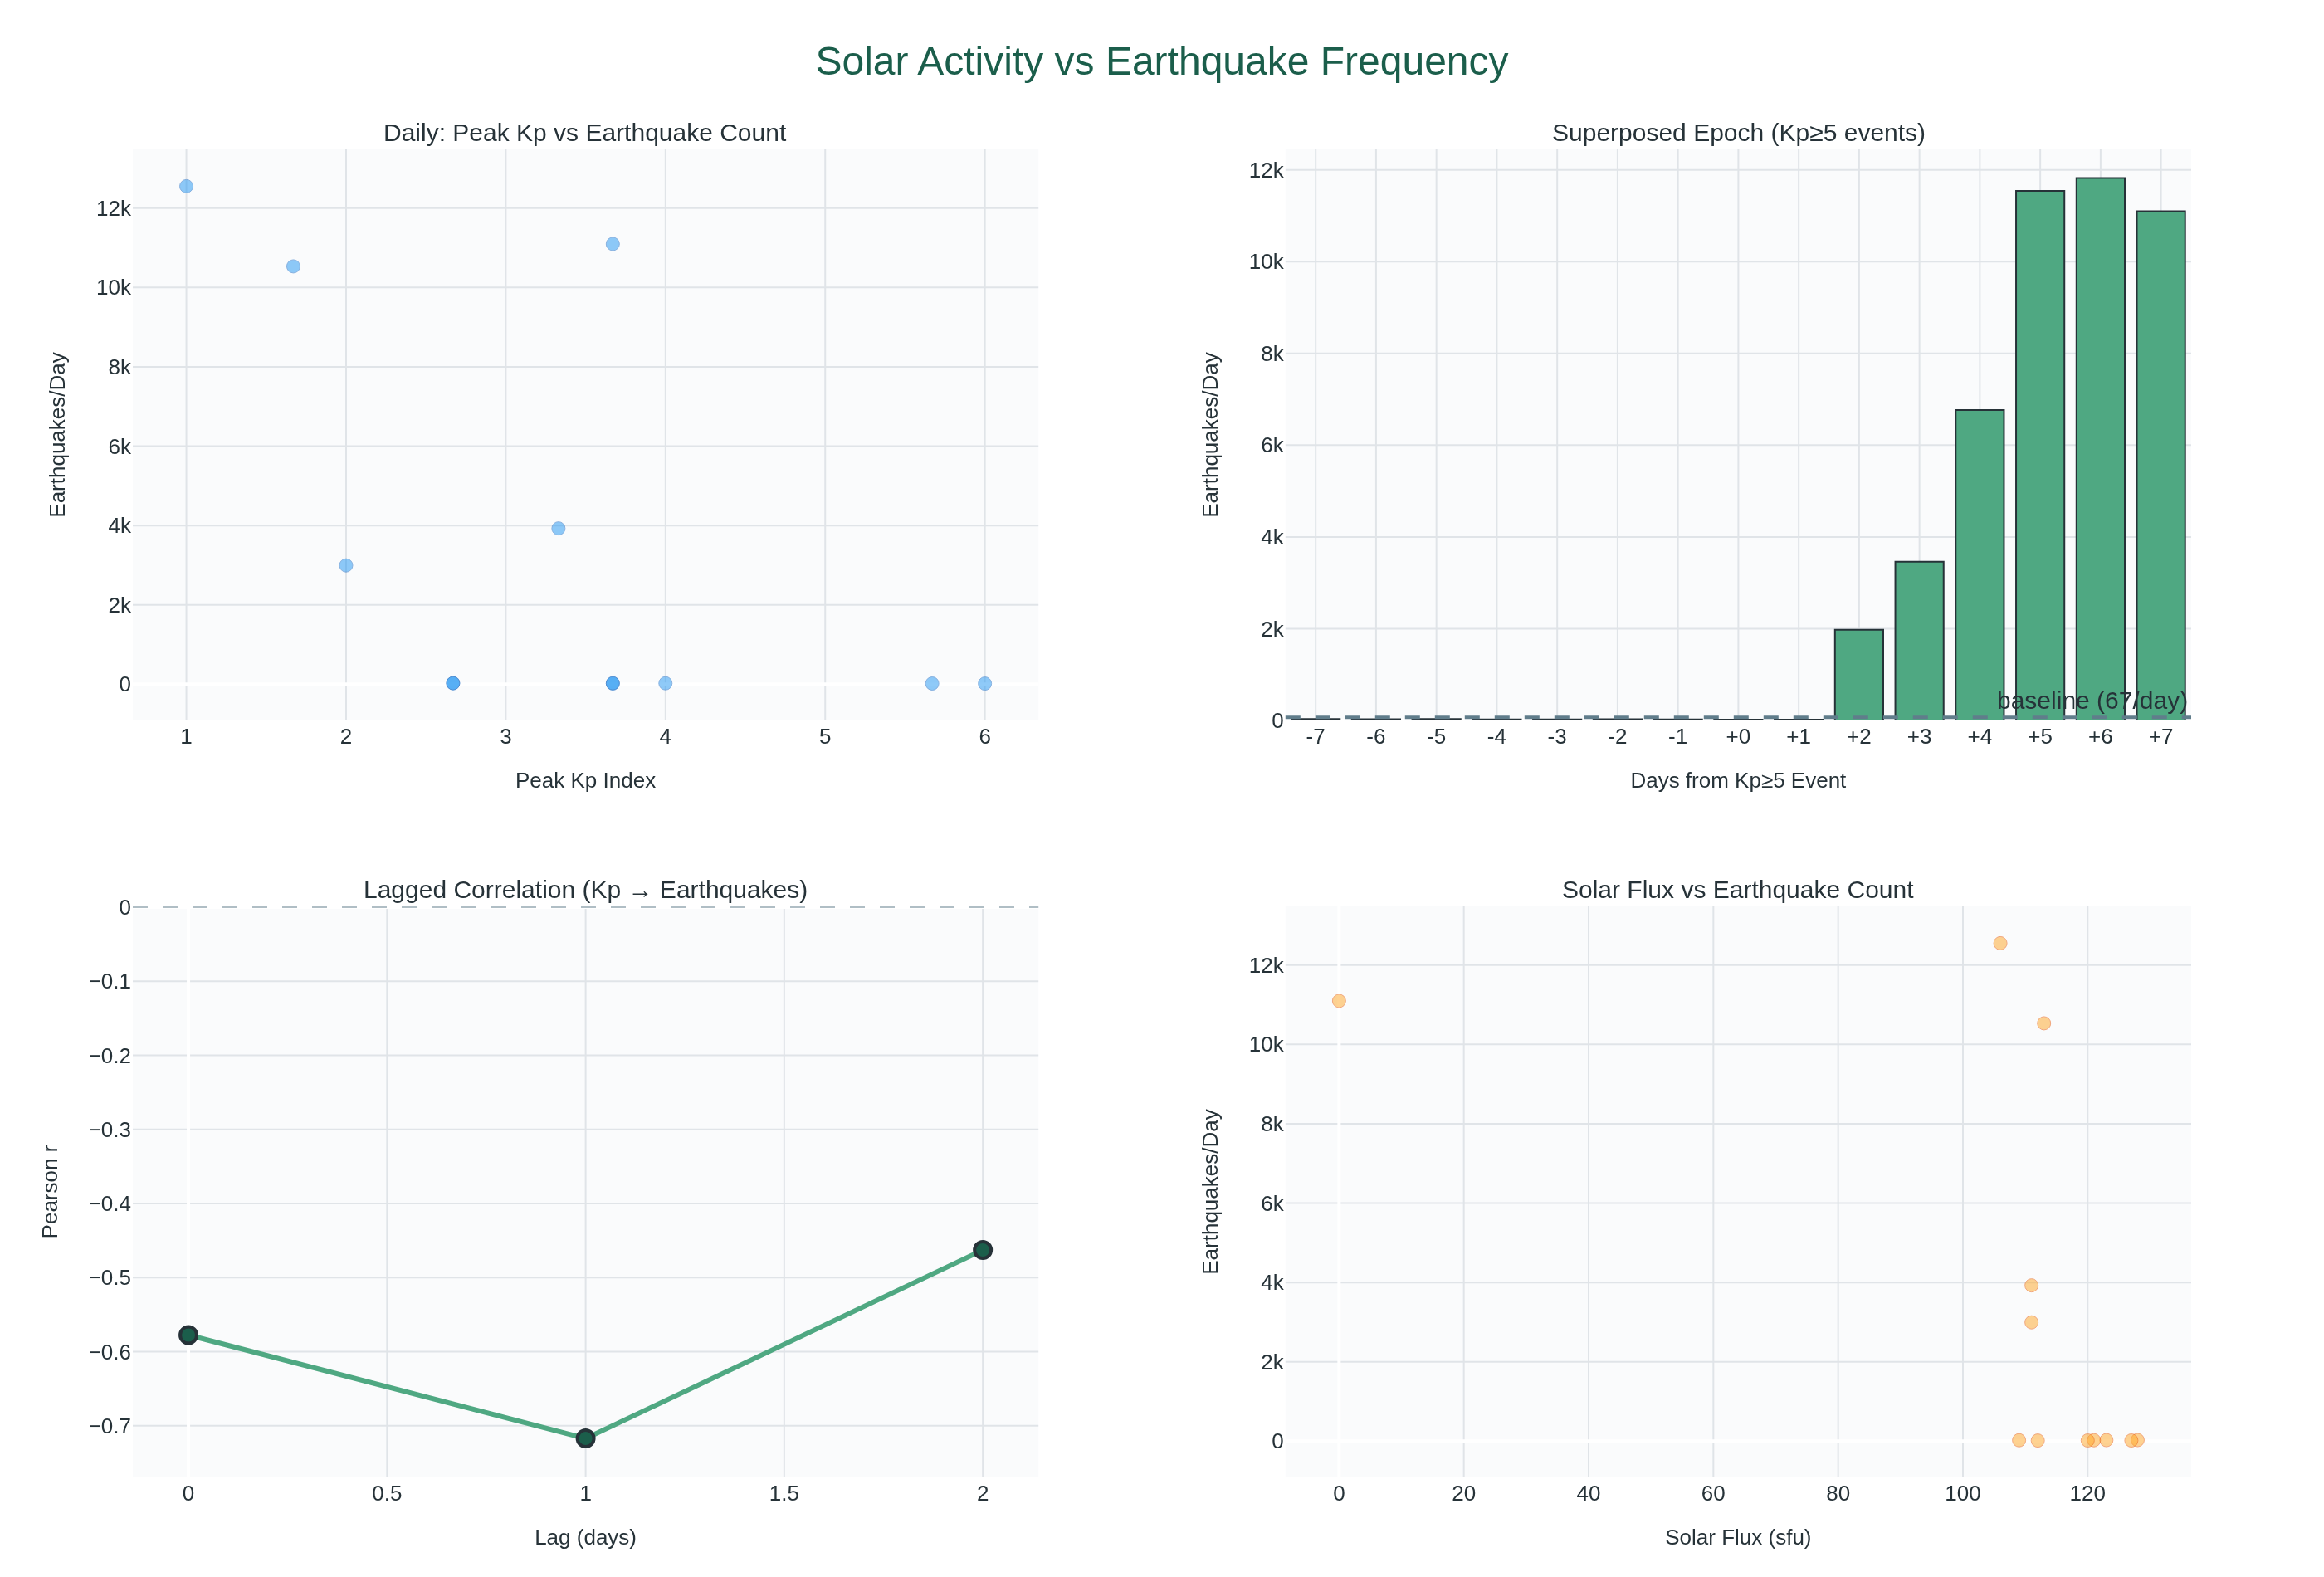
Solar Activity and Earthquake Frequency: Is There a Signal?
Testing the controversial hypothesis that solar activity (CMEs, solar flux, geomagnetic storms) correlates with earthquake frequency or magnitude. Using NOAA SWPC, NASA DONKI, and USGS earthquake data.
SeismologydraftMar 2026
Temporal Clustering of Global M4+ Earthquakes
Analyzing whether significant earthquakes cluster in time beyond what random (Poisson) occurrence would predict. Testing the hypothesis of earthquake triggering: does one large quake increase the probability of subsequent events?
ClimatedraftMar 2026
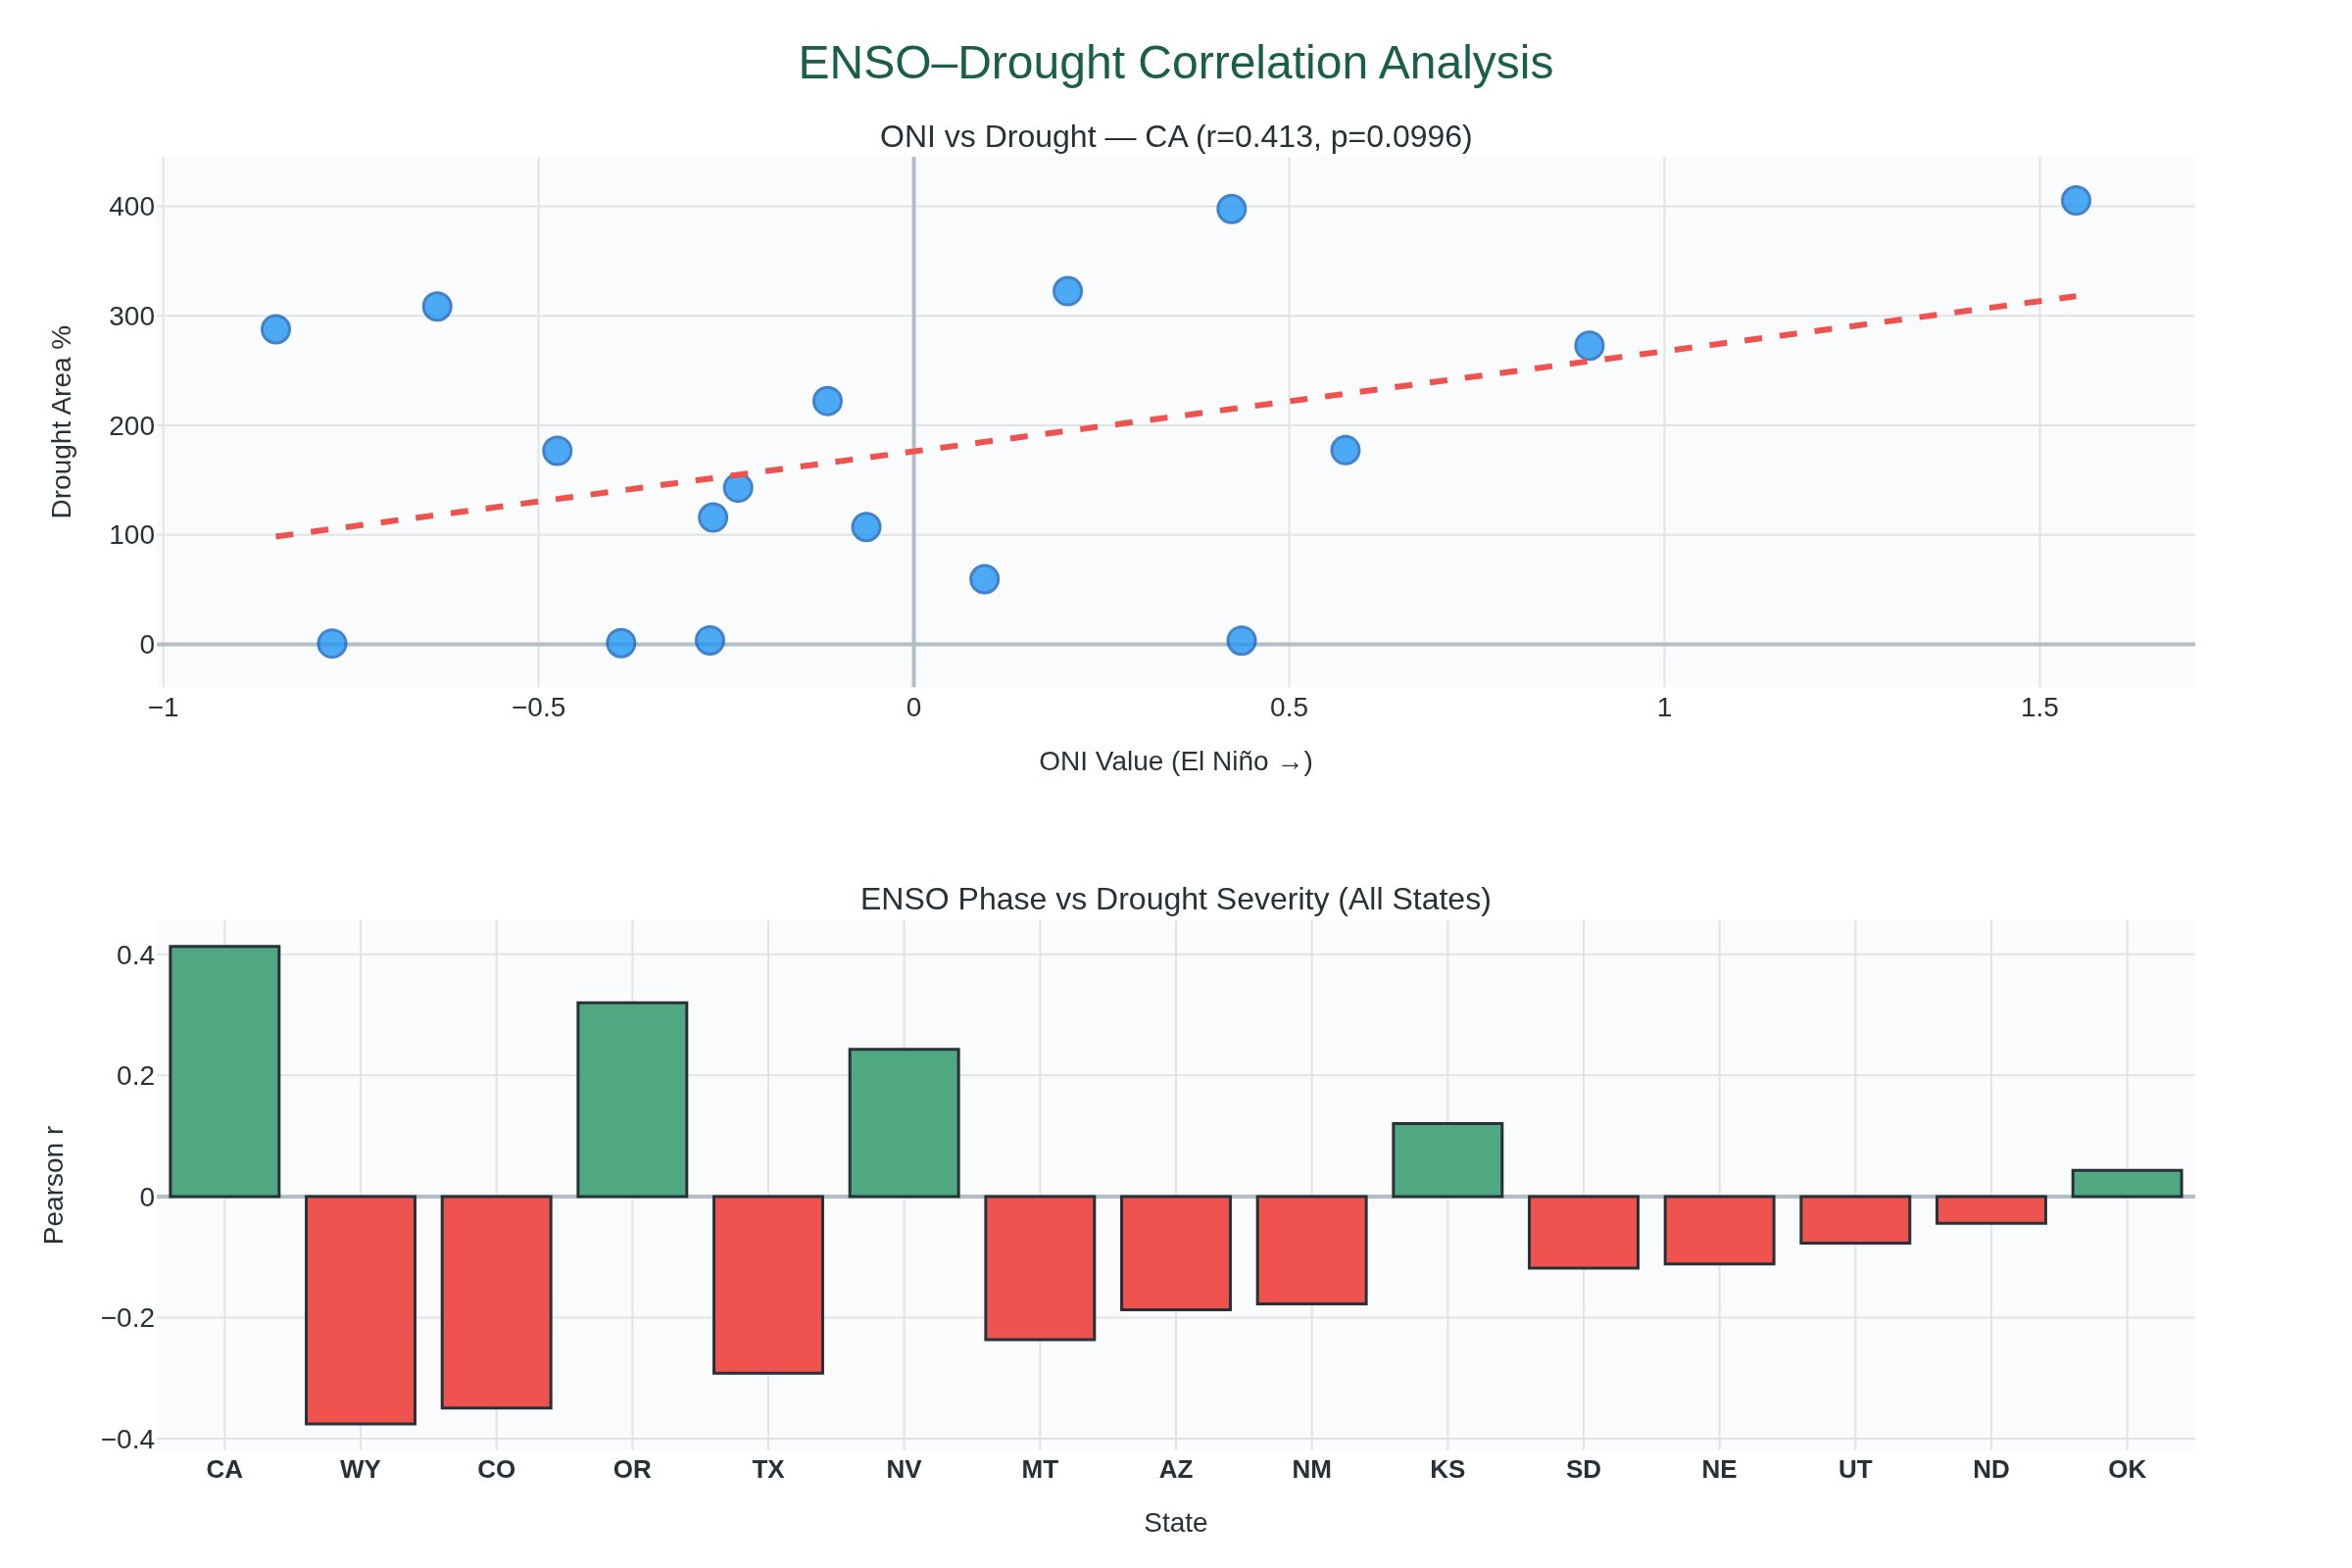
ENSO Phase vs US Drought Severity
Investigating whether El Niño/La Niña phases predict drought severity in US states. Using 76 years of ONI data and 16 years of USDM drought records.
in review
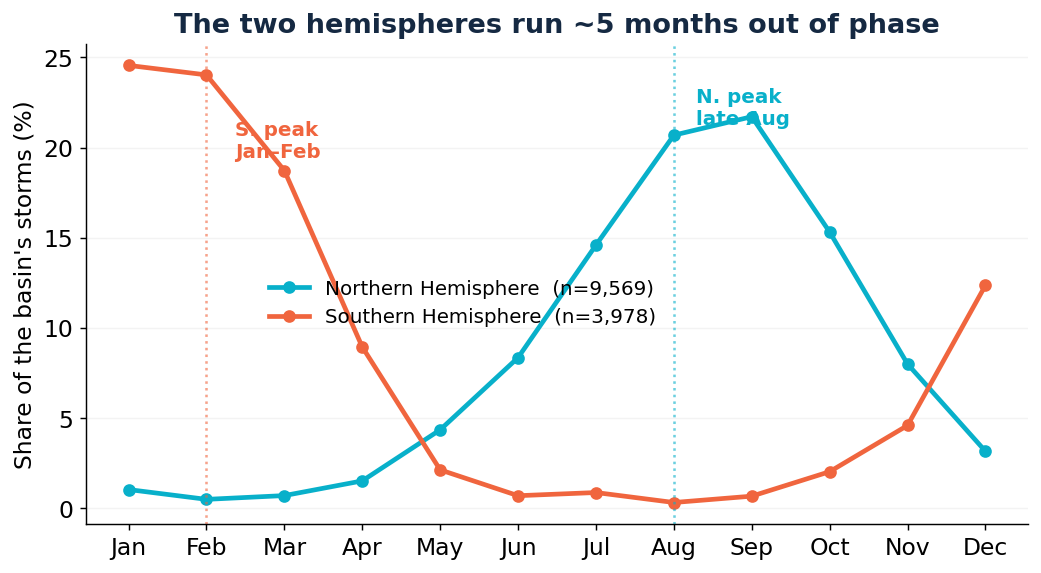
It's Always Hurricane Season Somewhere
No abstract in the index. See the workspace.